Technical Analysis of PLTK 2024-05-10
Overview:
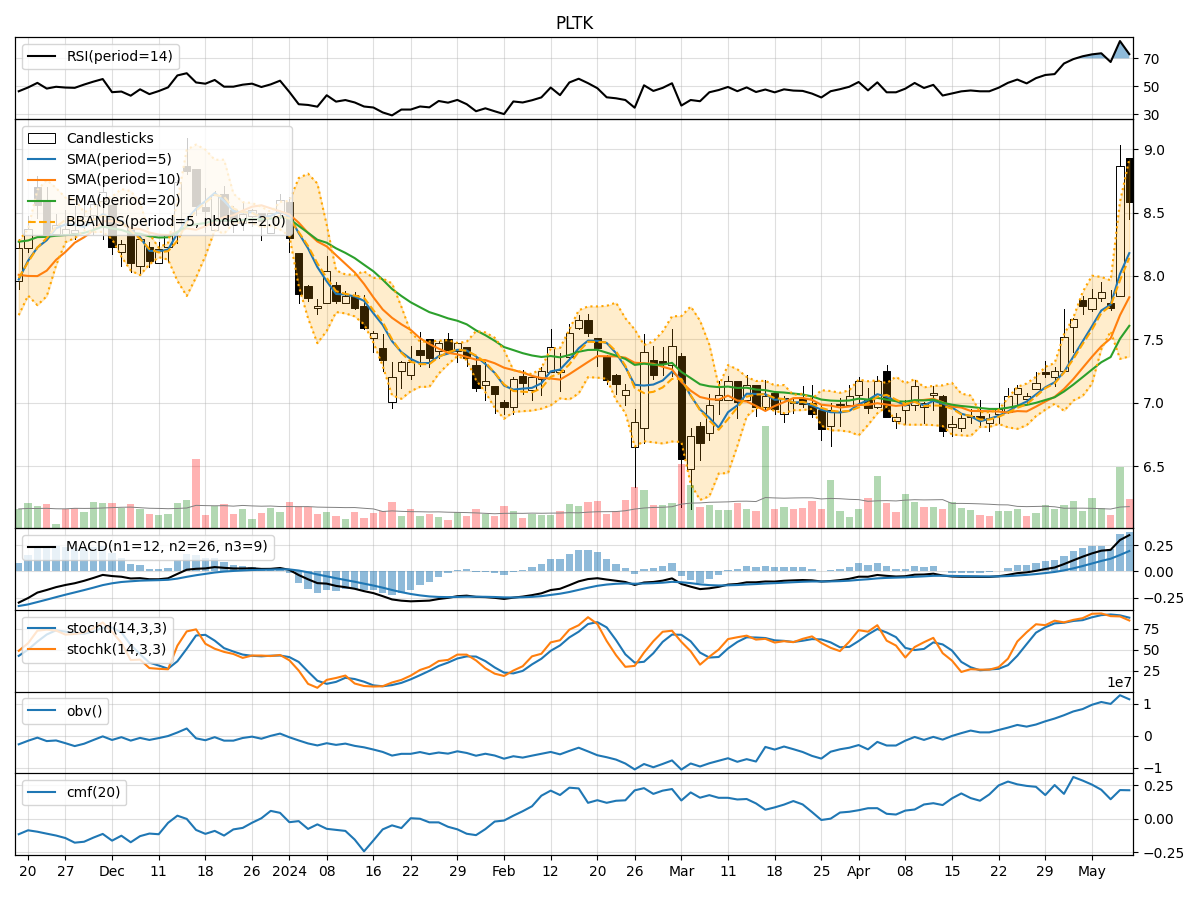
In analyzing the technical indicators for PLTK over the last 5 days, we will delve into the trend, momentum, volatility, and volume indicators to provide a comprehensive outlook on the possible stock price movement in the coming days.
Trend Indicators:
- Moving Averages (MA): The 5-day MA has been consistently above the closing price, indicating a bullish trend.
- MACD: The MACD line has been above the signal line, suggesting a bullish momentum.
- EMA: The exponential moving average has been trending upwards, supporting the bullish sentiment.
Momentum Indicators:
- RSI: The Relative Strength Index has been fluctuating but generally staying in the overbought territory, indicating strong buying momentum.
- Stochastic Oscillator: Both %K and %D have been relatively high, suggesting bullish momentum.
- Williams %R: The indicator has been in the oversold region, indicating a potential reversal to the upside.
Volatility Indicators:
- Bollinger Bands: The bands have been widening, indicating increased volatility in the stock price.
- Bollinger %B: The %B has been fluctuating within a range, suggesting potential price reversals.
Volume Indicators:
- On-Balance Volume (OBV): The OBV has been showing an overall increase, indicating accumulation by investors.
- Chaikin Money Flow (CMF): The CMF has been positive, suggesting buying pressure in the stock.
Key Observations:
- The trend indicators point towards a bullish sentiment with moving averages and MACD supporting an upward trend.
- Momentum indicators indicate strong buying momentum with RSI in the overbought region and stochastic oscillators showing bullish signals.
- Volatility has been increasing, which could lead to larger price swings in the coming days.
- Volume indicators suggest accumulation by investors and positive buying pressure.
Conclusion:
Based on the analysis of the technical indicators, the stock is likely to continue its upward momentum in the coming days. The bullish trend supported by moving averages, MACD, RSI, and positive volume indicators indicates a favorable outlook for PLTK. Traders and investors may consider buying opportunities in anticipation of further price appreciation. It is important to monitor the indicators closely for any signs of reversal or increased volatility.