Technical Analysis of PLAO 2024-05-10
Overview:
In analyzing the technical indicators for PLAO over the last 5 days, we will delve into the trend, momentum, volatility, and volume indicators to provide a comprehensive outlook on the possible stock price movement. By examining these key aspects, we aim to offer valuable insights and predictions for the upcoming days.
Trend Analysis:
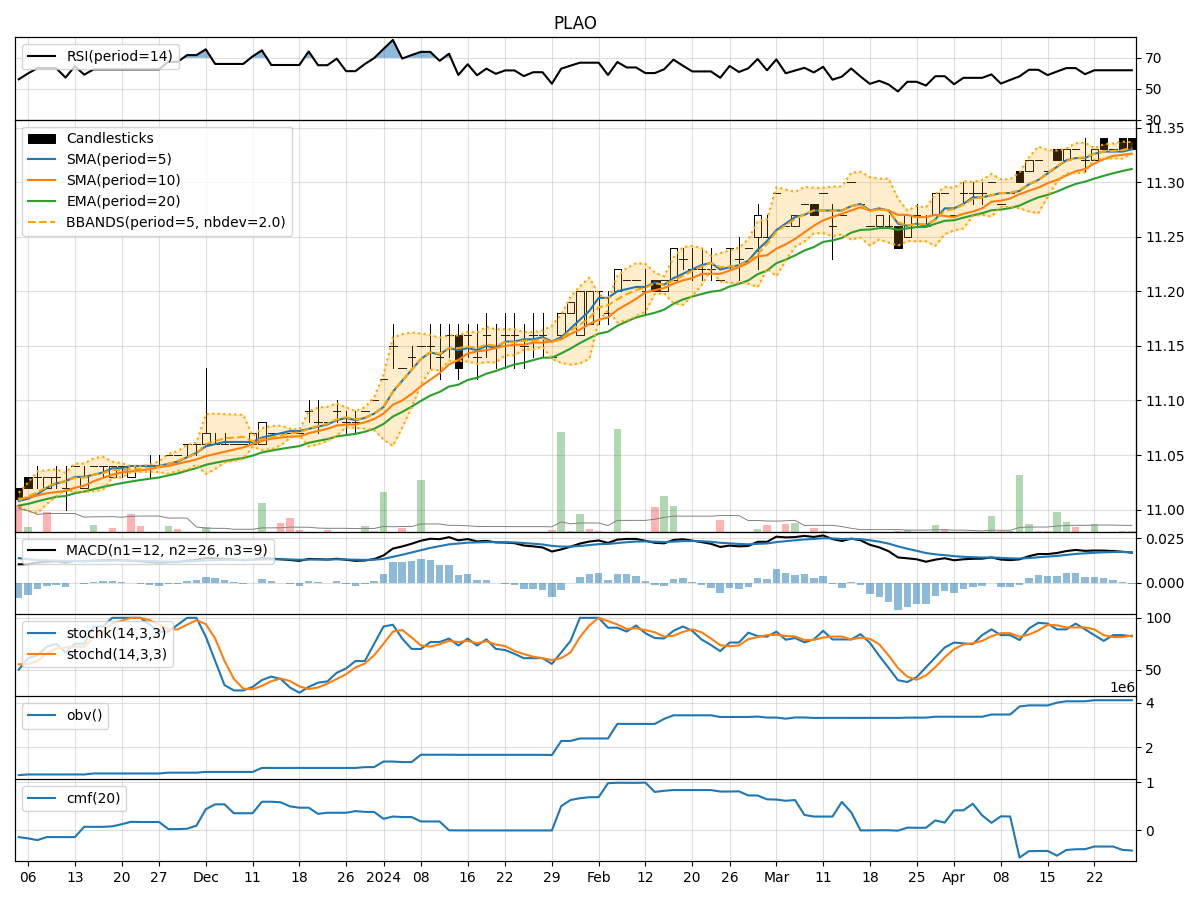
- Moving Averages (MA): The 5-day MA has been consistently above the 10-day SMA, indicating a short-term bullish trend.
- Exponential Moving Average (EMA): The EMA has been showing a gradual uptrend, suggesting positive price momentum.
- Moving Average Convergence Divergence (MACD): The MACD and signal line have been trending upwards, indicating increasing bullish momentum.
Momentum Analysis:
- Relative Strength Index (RSI): The RSI has been hovering around 60-65, indicating a neutral to slightly bullish momentum.
- Stochastic Oscillator (Stoch): Both %K and %D have been in the overbought territory, suggesting a potential reversal or consolidation.
- Williams %R (WillR): The Williams %R has been fluctuating in the oversold region, indicating a potential buying opportunity.
Volatility Analysis:
- Bollinger Bands (BB): The price has been trading within the bands, suggesting a period of consolidation or range-bound movement.
- Bollinger Band Width (BBW): The BBW has been relatively stable, indicating low volatility in the short term.
Volume Analysis:
- On-Balance Volume (OBV): The OBV has been relatively flat, indicating a balance between buying and selling pressure.
- Chaikin Money Flow (CMF): The CMF has been negative, suggesting a net outflow of money from the stock.
Key Observations:
- The trend indicators point towards a bullish bias in the short term.
- Momentum indicators show a mixed signal with potential for a reversal or consolidation.
- Volatility remains low, indicating a period of stability.
- Volume indicators suggest a lack of strong buying or selling pressure.
Conclusion:
Based on the analysis of the technical indicators, the stock price of PLAO is likely to experience sideways movement or consolidation in the upcoming days. While the trend indicators signal a bullish bias, the mixed momentum and volume indicators suggest a lack of strong conviction in either direction. Traders may consider adopting a neutral stance or wait for clearer signals before making significant trading decisions.