Technical Analysis of PHAR 2024-05-10
Overview:
In analyzing the technical indicators for PHAR over the last 5 days, we will delve into the trend, momentum, volatility, and volume indicators to provide a comprehensive outlook on the possible stock price movement in the coming days. By examining these key factors, we aim to offer valuable insights and predictions for potential investors.
Trend Analysis:
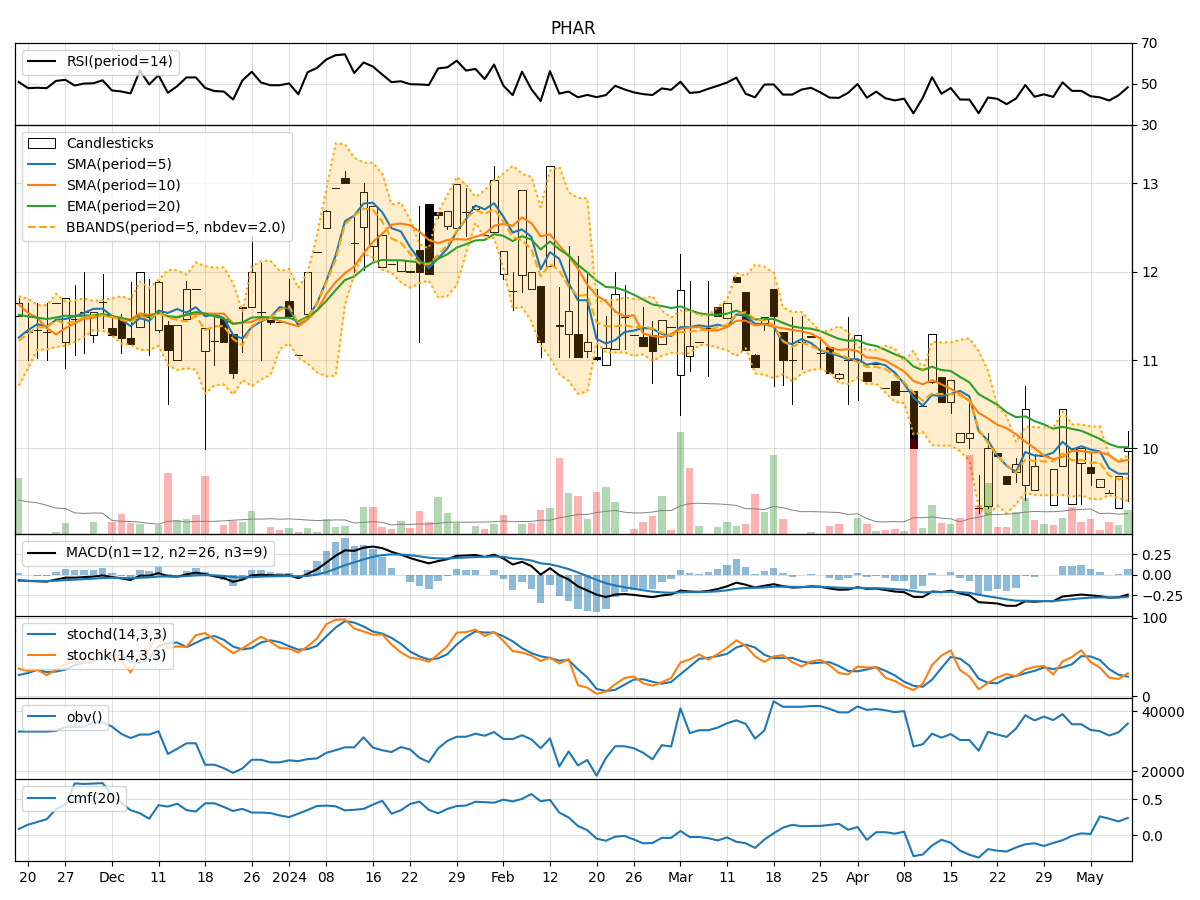
- Moving Averages (MA): The 5-day Moving Average (MA) has been fluctuating around the closing prices, indicating short-term price trends. The Simple Moving Average (SMA) and Exponential Moving Average (EMA) suggest a downward trend, with prices below the averages.
- Moving Average Convergence Divergence (MACD): The MACD line has been negative, indicating a bearish trend. However, the MACD Histogram has shown some signs of improvement in the last day.
Momentum Analysis:
- Relative Strength Index (RSI): The RSI has been hovering around the mid-range, indicating a neutral momentum in the stock.
- Stochastic Oscillator: Both %K and %D have been in the oversold territory, suggesting a potential reversal in the stock's price.
- Williams %R (Willams %R): The Williams %R is also in the oversold region, indicating a possible buying opportunity.
Volatility Analysis:
- Bollinger Bands (BB): The Bollinger Bands have been narrowing, suggesting decreased volatility in the stock price. The bands are currently close to the lower range, indicating a potential rebound in prices.
Volume Analysis:
- On-Balance Volume (OBV): The OBV has shown mixed signals, with fluctuations in volume accumulation. This indicates indecision among investors regarding the stock.
- Chaikin Money Flow (CMF): The CMF has been positive, indicating that money is flowing into the stock. However, the rate of inflow has been inconsistent.
Key Observations:
- The trend indicators suggest a bearish sentiment in the short term, with prices below key moving averages.
- Momentum indicators show a neutral stance, with potential signs of a reversal in the oversold region.
- Volatility has decreased, indicating a possible consolidation phase before a potential breakout.
- Volume indicators reflect mixed signals, with uncertainty among investors regarding the stock's direction.
Conclusion:
Based on the analysis of the technical indicators, the stock price of PHAR is likely to experience further downward movement in the short term. However, there are indications of a potential reversal in momentum, as suggested by the oversold conditions in the stochastic oscillator and Williams %R. Investors should closely monitor the price action for any signs of a trend reversal or consolidation before considering entry or exit points. It is advisable to exercise caution and wait for more definitive signals before making any trading decisions.