Technical Analysis of PEP 2024-05-10
Overview:
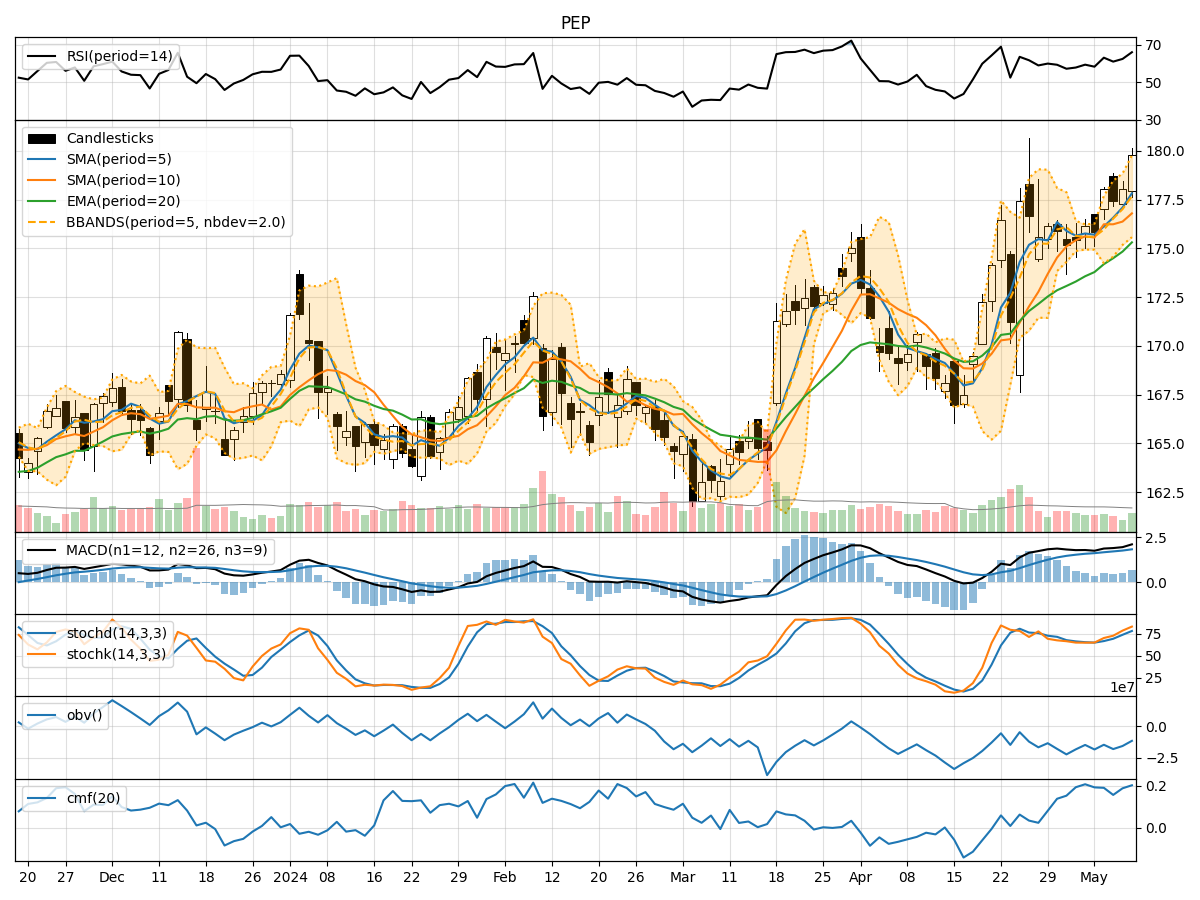
In the last 5 trading days, PepsiCo Inc. (PEP) has shown a consistent uptrend in its stock price, accompanied by increasing trading volumes. The moving averages have been trending upwards, indicating a positive momentum in the stock. Momentum indicators such as RSI and Stochastic oscillators suggest that the stock is currently in overbought territory. Volatility indicators show that the stock price has been trading within the Bollinger Bands, with a slight expansion in volatility. Volume indicators reflect mixed sentiment with fluctuations in On-Balance Volume (OBV) and Chaikin Money Flow (CMF).
Trend Analysis:
- Moving Averages (MA): The 5-day MA has been consistently above the 10-day SMA, indicating a short-term bullish trend. The EMA(20) has also been trending upwards, supporting the bullish momentum.
- MACD: The MACD line has been above the signal line for the past 5 days, indicating a bullish trend. The MACD histogram has shown a gradual increase, suggesting strengthening bullish momentum.
Momentum Analysis:
- RSI: The RSI has been above 70 for the last few days, indicating an overbought condition. This could potentially lead to a short-term pullback or consolidation.
- Stochastic Oscillators: Both %K and %D have been in the overbought zone, signaling a potential reversal or correction in the stock price.
Volatility Analysis:
- Bollinger Bands (BB): The stock price has been trading within the Bollinger Bands, with a slight expansion in volatility. The upper and lower bands have widened, suggesting increased price fluctuations.
Volume Analysis:
- On-Balance Volume (OBV): The OBV has shown mixed movements, indicating uncertainty in the buying and selling pressure. The recent decline in OBV could signal a potential decrease in buying interest.
- Chaikin Money Flow (CMF): The CMF has been fluctuating around the zero line, indicating a balance between buying and selling pressure.
Conclusion:
Based on the technical indicators analyzed: - Trend: The stock is in a strong upward trend, supported by moving averages and MACD. - Momentum: The stock is currently overbought according to RSI and Stochastic oscillators, suggesting a potential short-term correction or consolidation. - Volatility: The slight expansion in volatility within the Bollinger Bands indicates increased price fluctuations. - Volume: Mixed signals from OBV and CMF suggest a lack of clear direction in buying and selling pressure.
Overall View:
Given the overbought conditions in momentum indicators and the potential for a short-term correction, the next few days could see a pullback or consolidation in PepsiCo's stock price. Traders should exercise caution and consider taking profits or implementing risk management strategies in anticipation of a possible downward movement.