Technical Analysis of PEGA 2024-05-31
Overview:
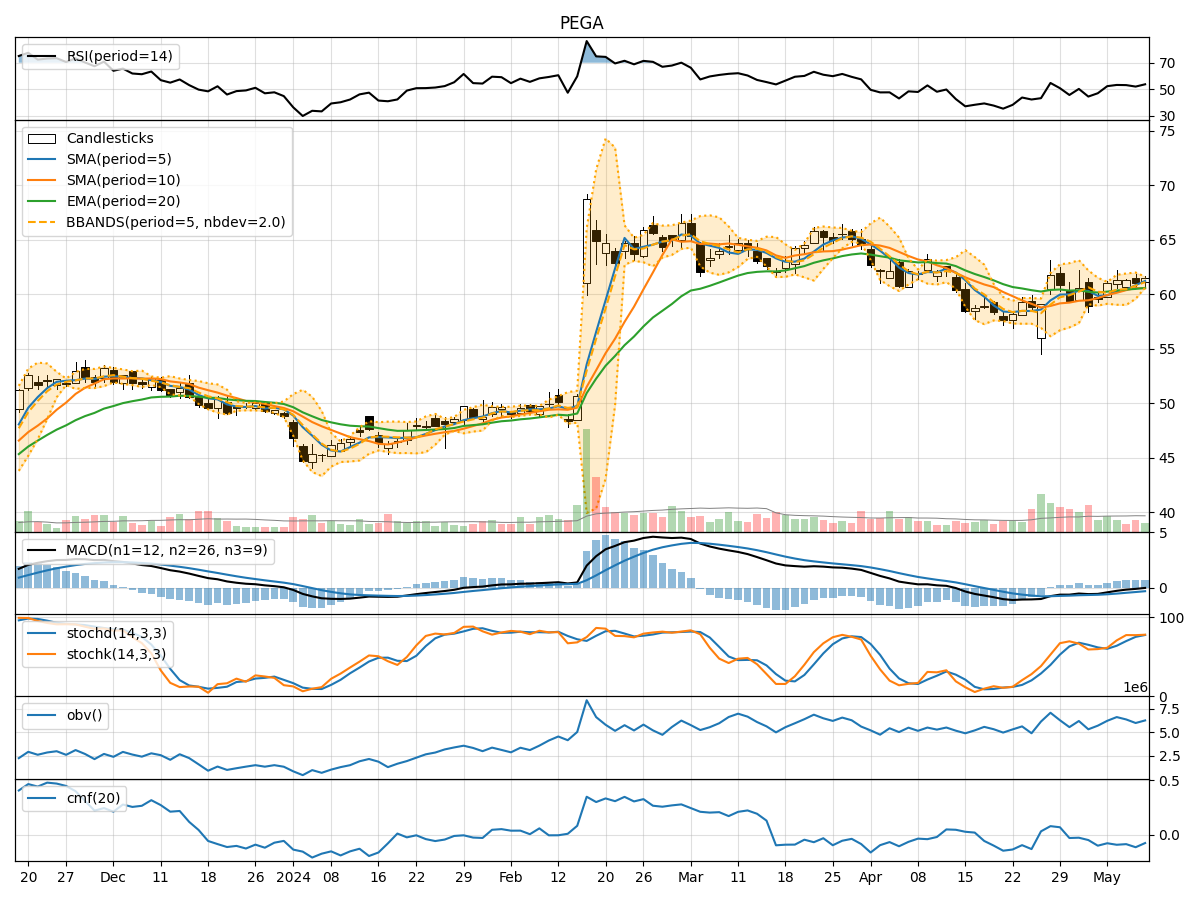
In analyzing the technical indicators for PEGA over the last 5 days, we will delve into the trend, momentum, volatility, and volume indicators to provide a comprehensive outlook on the possible stock price movement. By examining these key factors, we aim to offer valuable insights and predictions for the upcoming days.
Trend Analysis:
- Moving Averages (MA): The 5-day MA has been consistently below the closing prices, indicating a downward trend.
- MACD: The MACD line has been below the signal line, suggesting bearish momentum.
- EMA: The EMA has been declining, further supporting the bearish trend.
Key Observation: The trend indicators point towards a downward trajectory for PEGA.
Momentum Analysis:
- RSI: The RSI has been decreasing, reflecting weakening momentum.
- Stochastic Oscillator: Both %K and %D have been trending lower, indicating bearish momentum.
- Williams %R: The indicator has been in oversold territory, signaling a potential reversal.
Key Observation: Momentum indicators suggest a bearish sentiment for PEGA.
Volatility Analysis:
- Bollinger Bands (BB): The stock price has been trading below the lower Bollinger Band, indicating oversold conditions.
- Bollinger Band Width: The band width has been narrowing, suggesting reduced volatility.
Key Observation: Volatility indicators imply a potential reversal or consolidation phase.
Volume Analysis:
- On-Balance Volume (OBV): The OBV has been fluctuating, indicating mixed buying and selling pressure.
- Chaikin Money Flow (CMF): The CMF has been negative, signaling outflows.
Key Observation: Volume indicators show mixed signals with a slight bearish bias.
Conclusion:
Based on the analysis of trend, momentum, volatility, and volume indicators, the overall outlook for PEGA in the next few days appears bearish. The stock is likely to continue its downward trend with weakening momentum and mixed volume signals. However, the narrowing Bollinger Bands suggest a potential reversal or consolidation phase in the near term.
Key Conclusion: The stock is expected to experience further downside in the upcoming days, with a possibility of consolidation before a potential reversal. Investors should exercise caution and consider risk management strategies in their trading decisions.