Technical Analysis of PBM 2024-05-10
Overview:
In analyzing the technical indicators for PBM stock over the last 5 days, we will delve into the trend, momentum, volatility, and volume indicators to provide a comprehensive outlook on the possible stock price movement in the coming days. By examining these key indicators, we aim to offer valuable insights and predictions for potential investors.
Trend Indicators:
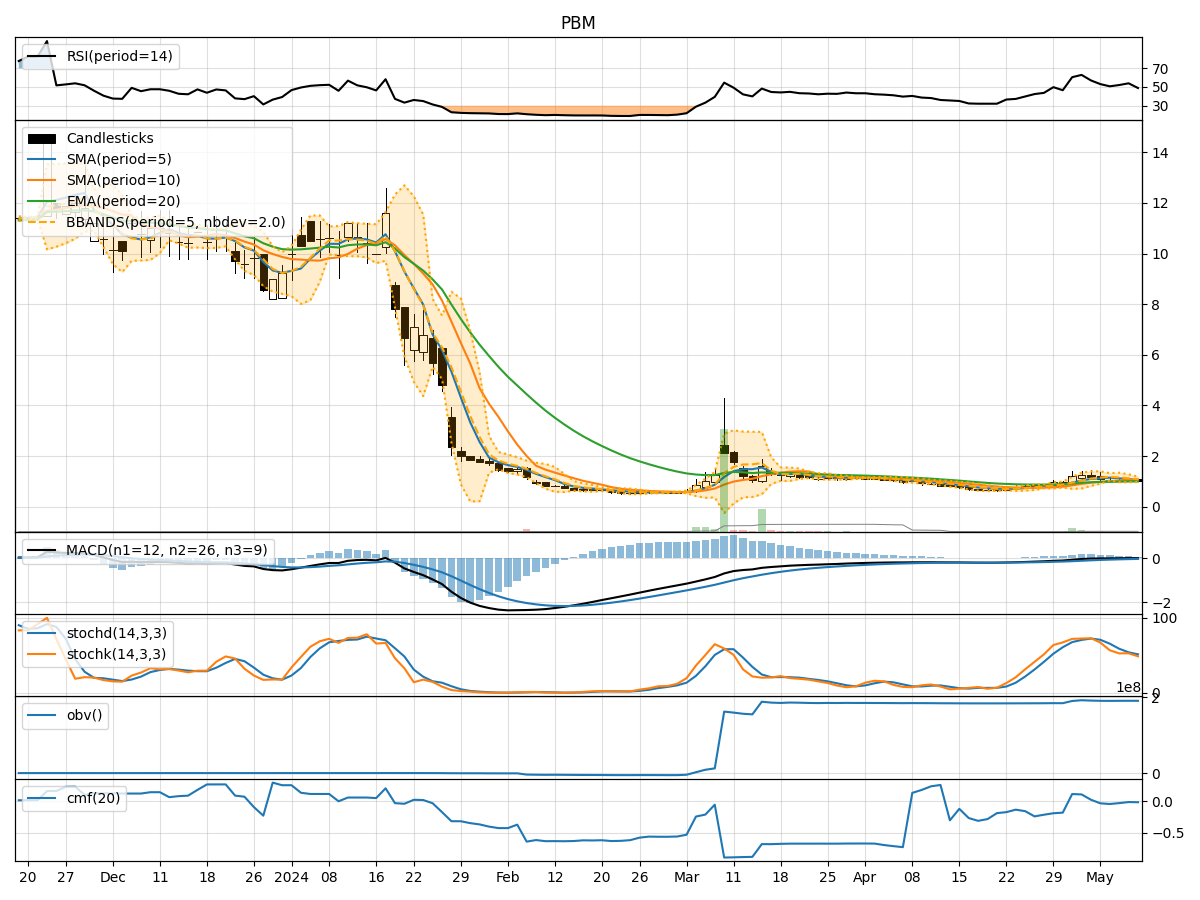
- Moving Averages (MA): The 5-day MA has been consistently below the closing price, indicating a short-term downtrend.
- MACD: The MACD line has been positive but decreasing, suggesting a weakening bullish momentum.
- EMA: The EMA has been gradually increasing, reflecting a potential reversal in the downtrend.
Momentum Indicators:
- RSI: The RSI has been fluctuating around the neutral zone, indicating indecision in the market.
- Stochastic Oscillator: Both %K and %D have been declining, signaling a potential bearish momentum.
- Williams %R: The indicator has been in oversold territory, suggesting a possible reversal to the upside.
Volatility Indicators:
- Bollinger Bands (BB): The stock price has been trading within the bands, indicating a period of consolidation.
- BB Width: The width of the bands has been narrowing, suggesting a decrease in volatility.
- BB %B: The %B indicator has been hovering around the midpoint, reflecting a balanced market sentiment.
Volume Indicators:
- On-Balance Volume (OBV): The OBV has been relatively stable, indicating no significant divergence between price and volume.
- Chaikin Money Flow (CMF): The CMF has been negative, suggesting selling pressure in the market.
Key Observations:
- The trend indicators show a mixed signal with a potential reversal in the EMA.
- Momentum indicators indicate a lack of clear direction in the market.
- Volatility indicators suggest a period of consolidation with decreasing volatility.
- Volume indicators point towards a balanced market sentiment with no significant divergence.
Conclusion:
Based on the analysis of the technical indicators, the stock price of PBM is likely to experience sideways movement in the coming days. The mixed signals from trend and momentum indicators, coupled with the consolidation pattern indicated by volatility indicators, suggest a lack of clear trend direction. Investors should exercise caution and closely monitor key support and resistance levels for potential breakout opportunities.