Technical Analysis of PASG 2024-05-31
Overview:
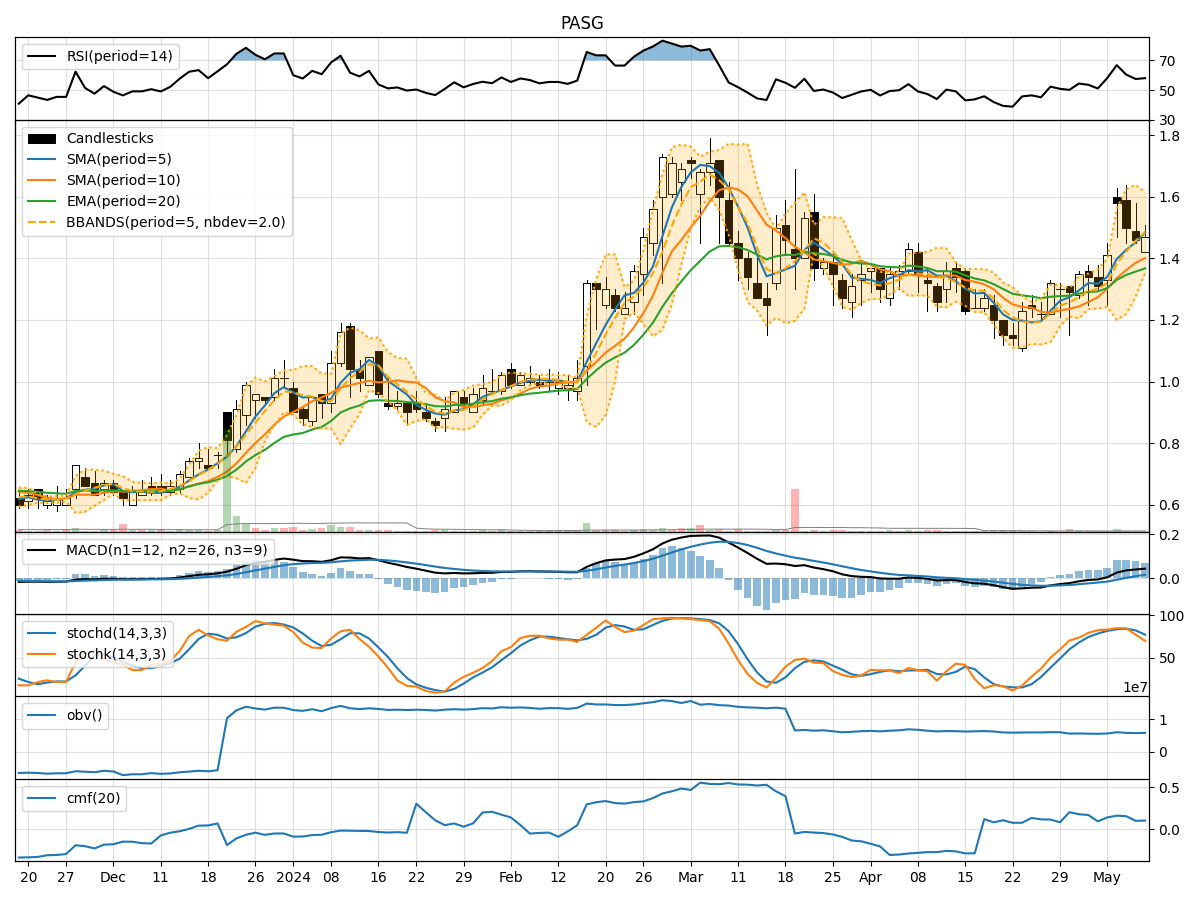
In analyzing the technical indicators for PASG over the last 5 days, we will delve into the trend, momentum, volatility, and volume indicators to provide a comprehensive outlook on the possible stock price movement in the coming days.
Trend Analysis:
- Moving Averages (MA): The 5-day MA has been consistently below the closing price, indicating a short-term downtrend.
- MACD: The MACD line has been decreasing, signaling a bearish trend.
- RSI: The RSI values have been relatively low, suggesting a potential oversold condition.
Momentum Analysis:
- Stochastic Oscillator: Both %K and %D values have been declining, indicating weakening momentum.
- Williams %R: The indicator has been in the oversold territory, suggesting a potential reversal.
Volatility Analysis:
- Bollinger Bands (BB): The stock price has been trading below the lower Bollinger Band, indicating oversold conditions.
- BB Percentage (BBP): The BBP values have been increasing, suggesting a potential bounce back.
Volume Analysis:
- On-Balance Volume (OBV): The OBV values have been negative, indicating selling pressure.
- Chaikin Money Flow (CMF): The CMF values have been relatively low, indicating a lack of buying interest.
Key Observations:
- The stock is currently in a downtrend based on moving averages and MACD.
- Momentum indicators suggest weakening momentum and a potential oversold condition.
- Volatility indicators point towards oversold conditions but also a potential reversal.
- Volume indicators indicate selling pressure and a lack of buying interest.
Conclusion:
Based on the analysis of the technical indicators, the next few days for PASG are likely to see a continuation of the downtrend with weakening momentum and oversold conditions. However, the increasing BBP values and potential reversal signals from volatility indicators could hint at a short-term bounce back or consolidation before further downside. Traders should exercise caution and closely monitor key support levels for potential entry or exit points.
Recommendation:
Given the current technical outlook, it is advisable to wait for confirmation of a reversal pattern or a significant increase in buying interest before considering any long positions. Short-term traders may look for opportunities to capitalize on potential bounces within the overall downtrend. Long-term investors should exercise patience and wait for more favorable technical signals before considering any new positions.