Technical Analysis of OXBR 2024-05-10
Overview:
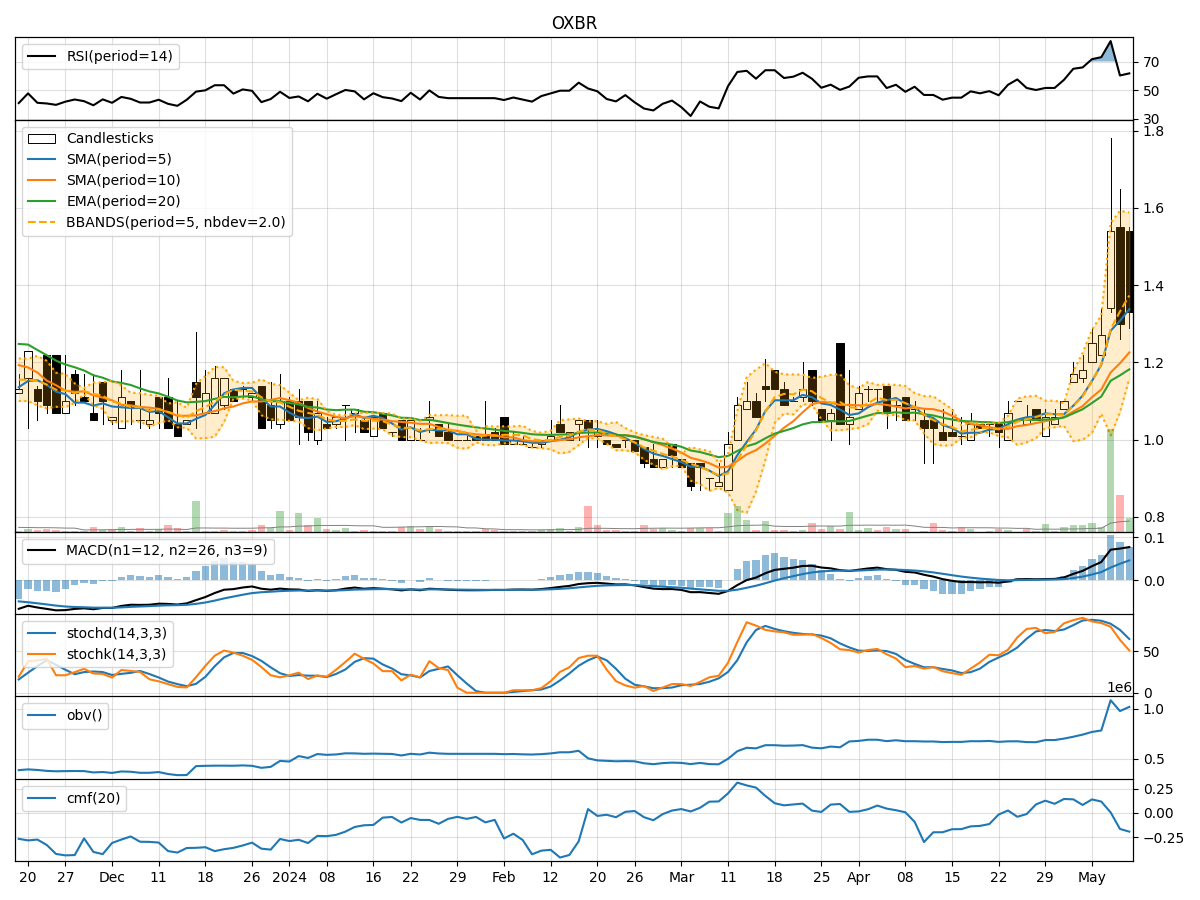
In analyzing the technical indicators for OXBR over the last 5 days, we will delve into the trends, momentum, volatility, and volume aspects to provide a comprehensive outlook on the possible stock price movement. By examining key indicators such as moving averages, MACD, RSI, Bollinger Bands, and OBV, we aim to offer valuable insights and predictions for the upcoming days.
Trend Analysis:
- Moving Averages (MA): The 5-day moving average has been consistently rising, indicating a bullish trend in the short term.
- MACD: The MACD line has been above the signal line, suggesting positive momentum in the stock price.
- EMA: The exponential moving average has also been trending upwards, supporting the bullish sentiment.
Momentum Analysis:
- RSI: The Relative Strength Index has shown fluctuations but generally remains in the neutral zone, indicating a balanced momentum.
- Stochastic Oscillator: Both %K and %D have been declining, signaling a potential reversal in momentum.
- Williams %R: The Williams %R is in oversold territory, suggesting a possible upcoming bullish momentum.
Volatility Analysis:
- Bollinger Bands: The stock price has been trading within the bands, indicating a period of consolidation.
- Bollinger Band Width: The narrowing of the band width suggests decreasing volatility and a potential breakout in the near future.
Volume Analysis:
- On-Balance Volume (OBV): The OBV has shown mixed signals, with fluctuations in volume accumulation.
- Chaikin Money Flow (CMF): The CMF has been negative, indicating selling pressure in the stock.
Key Observations:
- The stock is currently in a bullish trend based on moving averages and MACD.
- Momentum indicators suggest a potential reversal or consolidation in the short term.
- Volatility is decreasing, indicating a period of consolidation.
- Volume indicators show mixed signals, with selling pressure based on CMF.
Conclusion:
Based on the analysis of technical indicators, the next few days' possible stock price movement for OXBR is likely to be sideways with a slight bullish bias. Traders should watch for a potential breakout from the consolidation phase, keeping an eye on key support and resistance levels. It is advisable to wait for confirmation from momentum indicators before making significant trading decisions.