Technical Analysis of OTLY 2024-05-10
Overview:
In analyzing the technical indicators for OTLY over the last 5 days, we will delve into the trend, momentum, volatility, and volume indicators to provide a comprehensive outlook on the possible stock price movement in the coming days. By examining these key aspects, we aim to offer valuable insights and predictions to guide investment decisions.
Trend Analysis:
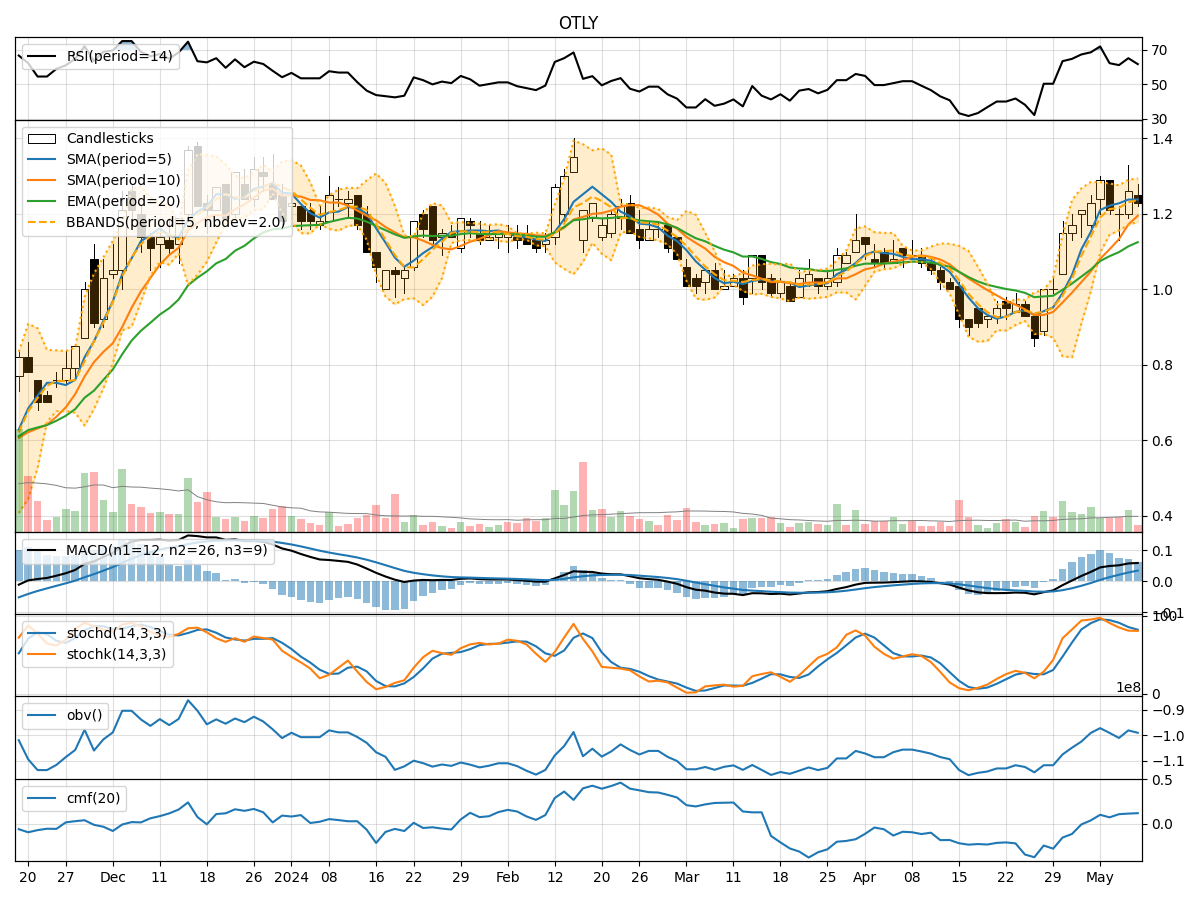
- Moving Averages (MA): The 5-day MA has been showing an upward trend, indicating a positive momentum in the short term.
- MACD: The MACD line has been consistently above the signal line, suggesting a bullish trend.
- EMA: The EMA has been steadily increasing, reflecting a positive price trend.
Key Observation: The trend indicators point towards a bullish sentiment in the stock price movement.
Momentum Analysis:
- RSI: The RSI values have been fluctuating but generally staying within the neutral to slightly overbought territory.
- Stochastic Oscillator: Both %K and %D values have been declining but remain in the overbought zone.
- Williams %R: The indicator has been hovering in the oversold region, indicating a potential reversal.
Key Observation: Momentum indicators suggest a mixed sentiment with a slight bias towards a bearish reversal.
Volatility Analysis:
- Bollinger Bands (BB): The stock price has been trading within the bands, indicating a stable price movement.
- Bollinger %B: The %B value has been fluctuating around the midline, suggesting a balanced volatility.
- Average True Range (ATR): The ATR values have been relatively stable, indicating consistent volatility levels.
Key Observation: Volatility indicators signal a period of consolidation and stability in price movement.
Volume Analysis:
- On-Balance Volume (OBV): The OBV values have been fluctuating but generally maintaining a positive trend, indicating accumulation.
- Chaikin Money Flow (CMF): The CMF values have been increasing, reflecting buying pressure in the stock.
Key Observation: Volume indicators suggest a positive sentiment with increasing buying interest.
Conclusion:
Based on the analysis of trend, momentum, volatility, and volume indicators, the overall outlook for OTLY in the next few days is bullish with a potential for upward movement. The trend indicators support a positive price trajectory, while momentum indicators hint at a possible bearish reversal. However, the stability in volatility and increasing buying pressure indicated by volume indicators point towards a favorable environment for price appreciation.
Key Conclusion: Considering the collective analysis of technical indicators, the stock is likely to experience upward movement in the coming days. Investors may consider taking long positions or holding onto existing positions with a bullish outlook.