Technical Analysis of OTEX 2024-05-10
Overview:
In analyzing the technical indicators for OTEX over the last 5 days, we will delve into the trend, momentum, volatility, and volume indicators to provide a comprehensive outlook on the possible stock price movement. By examining these key indicators, we aim to offer valuable insights and predictions for the upcoming days.
Trend Analysis:
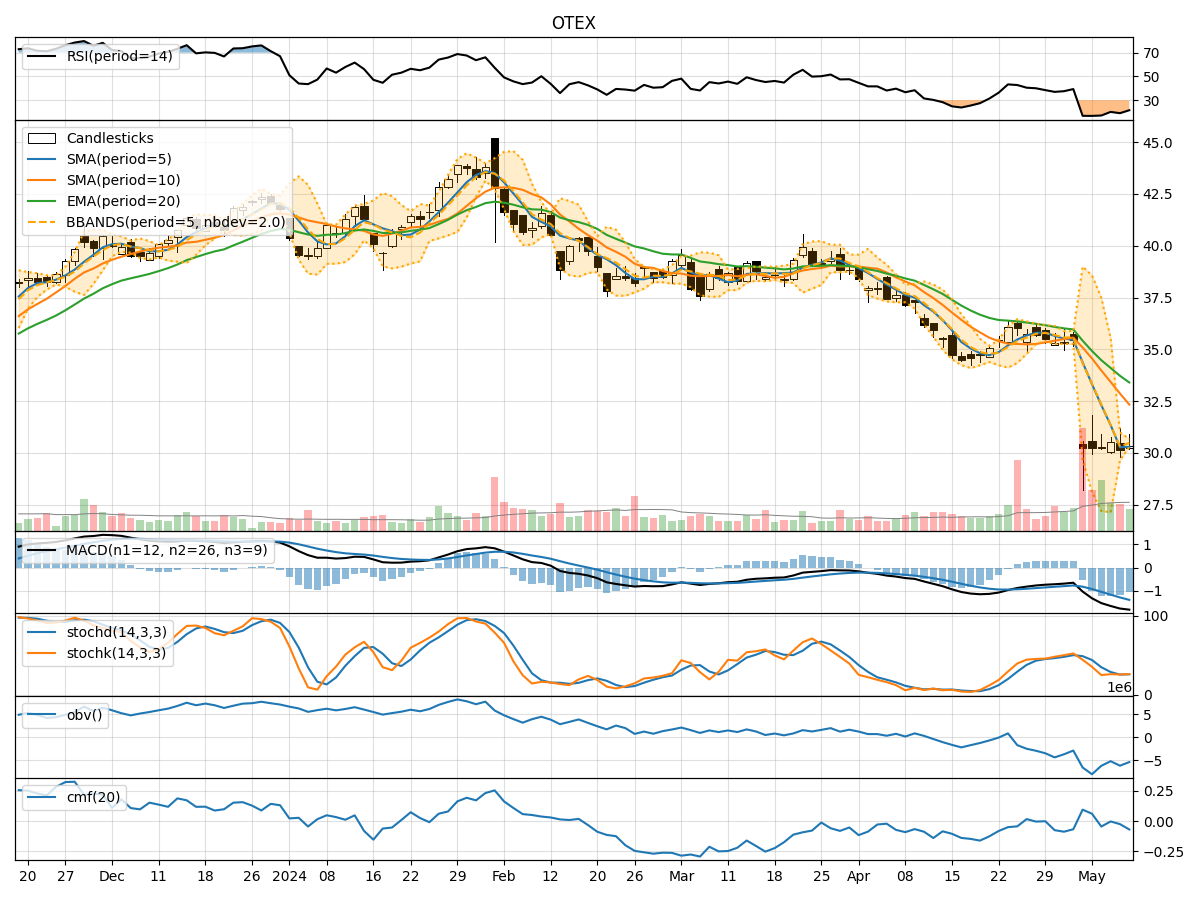
- Moving Averages (MA): The 5-day MA has been consistently below the longer-term SMAs and EMAs, indicating a downward trend in the stock price.
- MACD: The MACD line has been below the signal line, with negative values, suggesting bearish momentum in the stock.
- RSI: The RSI has been relatively low, indicating potential oversold conditions in the stock.
Momentum Analysis:
- Stochastic Oscillator: Both %K and %D have been below 30, signaling an oversold condition in the stock.
- Williams %R: The Williams %R has been consistently below -80, indicating an oversold market condition.
Volatility Analysis:
- Bollinger Bands (BB): The stock price has been trading below the lower Bollinger Band, suggesting potential oversold conditions.
- Bollinger Band %B: The %B indicator has been below 0.2, indicating a potential oversold condition.
Volume Analysis:
- On-Balance Volume (OBV): The OBV has been declining, indicating selling pressure in the stock.
- Chaikin Money Flow (CMF): The CMF has been negative, suggesting outflow of money from the stock.
Key Observations:
- The stock is currently in a downtrend based on moving averages and MACD.
- Momentum indicators suggest the stock is oversold.
- Volatility indicators point towards potential oversold conditions.
- Volume indicators indicate selling pressure in the stock.
Conclusion:
Based on the analysis of the technical indicators, the next few days' possible stock price movement for OTEX is likely to be sideways to slightly bearish. The stock is currently oversold, and while there may be some consolidation, the overall trend remains bearish. Traders should exercise caution and consider waiting for more definitive signals before making significant trading decisions.