Technical Analysis of OST 2024-05-10
Overview:
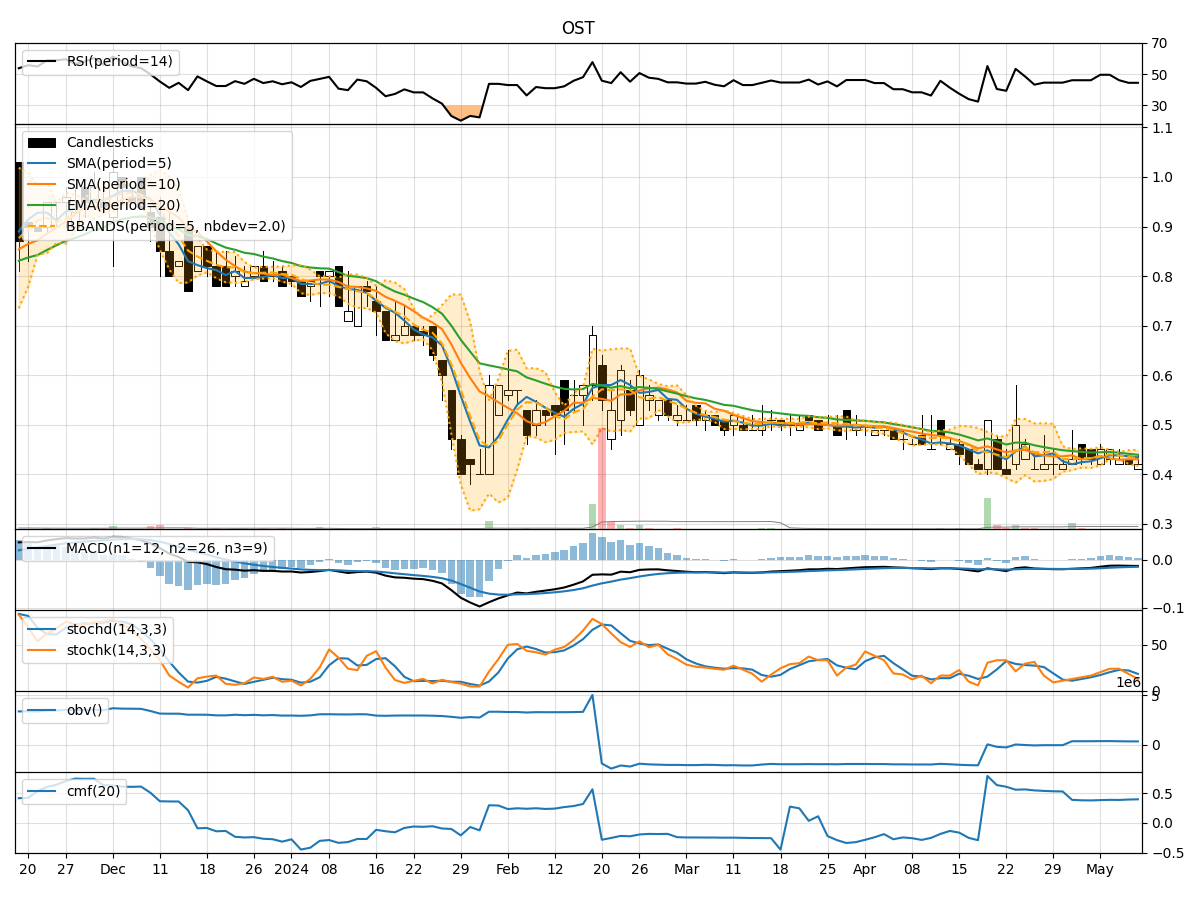
In analyzing the technical indicators for OST over the last 5 days, we will delve into the trend, momentum, volatility, and volume indicators to provide a comprehensive outlook on the possible stock price movement in the coming days. By examining these key indicators, we aim to offer valuable insights and predictions to guide your investment decisions.
Trend Analysis:
- Moving Averages (MA): The 5-day MA has been declining slightly, indicating a short-term bearish trend.
- MACD: The MACD line has been consistently below the signal line, suggesting a bearish momentum.
- EMA: The EMA has also been trending downwards, aligning with the bearish sentiment in the short term.
Key Observation: The trend indicators point towards a bearish outlook for OST in the short term.
Momentum Analysis:
- RSI: The RSI has been hovering around the mid-range, indicating a lack of strong momentum either bullish or bearish.
- Stochastic Oscillator: Both %K and %D have been decreasing, signaling a weakening momentum.
- Williams %R: The indicator has been in oversold territory, suggesting a potential reversal.
Key Observation: Momentum indicators reflect a neutral to slightly bearish sentiment with a possibility of a reversal.
Volatility Analysis:
- Bollinger Bands: The bands have been narrowing, indicating decreasing volatility.
- Bollinger %B: The %B has been fluctuating within a tight range, reflecting stable volatility levels.
Key Observation: Volatility indicators suggest a period of consolidation and stability in price movements.
Volume Analysis:
- On-Balance Volume (OBV): The OBV has been slightly declining, indicating some distribution.
- Chaikin Money Flow (CMF): The CMF has been relatively stable, showing a neutral money flow trend.
Key Observation: Volume indicators suggest a neutral stance with a slight inclination towards distribution.
Conclusion:
Based on the analysis of trend, momentum, volatility, and volume indicators, the overall outlook for OST in the next few days is bearish with a potential for a reversal in momentum. The trend indicators point towards a continued bearish trend, while momentum indicators suggest a possible shift in sentiment. Volatility indicators indicate a period of consolidation, and volume indicators reflect a neutral to slightly bearish stance.
In conclusion, the next few days for OST are likely to see a continuation of the bearish trend with a possibility of a reversal in momentum. Traders should exercise caution and closely monitor key support and resistance levels for potential entry or exit points.