Technical Analysis of OPRA 2024-05-10
Overview:
In analyzing the technical indicators for OPRA over the last 5 days, we will delve into the trend, momentum, volatility, and volume indicators to provide a comprehensive outlook on the possible stock price movement in the coming days. By examining these key aspects, we aim to offer valuable insights and predictions to guide your investment decisions.
Trend Indicators:
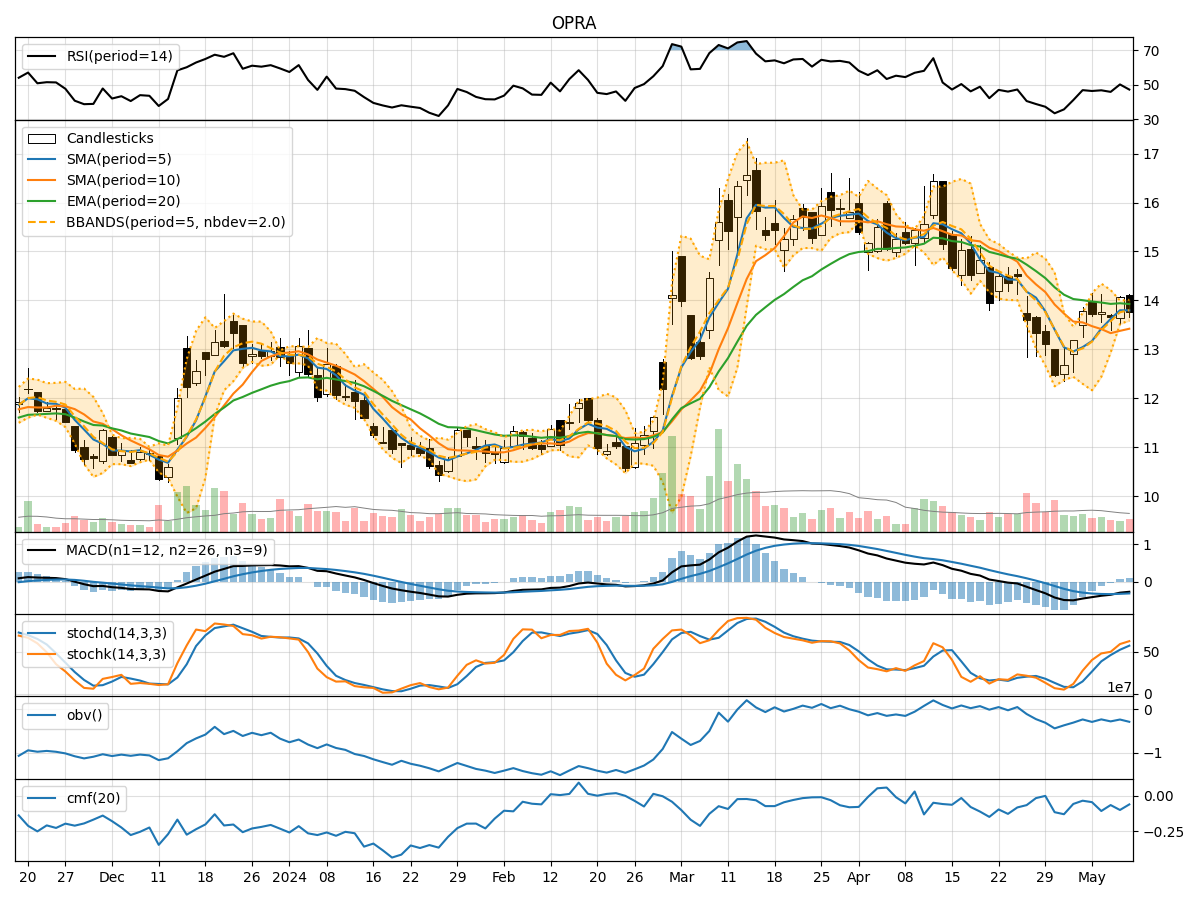
- Moving Averages (MA): The 5-day MA has been fluctuating around the closing prices, indicating short-term price trends. The SMA(10) and EMA(20) show a slight downward trend, suggesting a potential bearish sentiment.
- MACD: The MACD line has been consistently below the signal line, indicating a bearish trend. The MACD histogram has shown a slight uptick but remains in negative territory, signaling potential weakness in the stock price.
Momentum Indicators:
- RSI: The RSI has been hovering around the mid-range, indicating a neutral sentiment with no clear overbought or oversold conditions.
- Stochastic Oscillator: Both %K and %D lines of the Stochastic Oscillator have been trending upwards, suggesting a potential bullish momentum building up.
- Williams %R: The Williams %R is currently in oversold territory, indicating a possible reversal in the stock price.
Volatility Indicators:
- Bollinger Bands: The stock price has been trading within the Bollinger Bands, with the bands narrowing, indicating decreasing volatility. The %B indicator is below 1, suggesting a potential buying opportunity.
- Average True Range (ATR): The ATR has been relatively stable, indicating consistent price movements without significant spikes in volatility.
Volume Indicators:
- On-Balance Volume (OBV): The OBV has been fluctuating, indicating mixed buying and selling pressure in the stock.
- Chaikin Money Flow (CMF): The CMF has been negative, suggesting a net outflow of money from the stock over the past 20 days.
Key Observations and Opinions:
- Trend: The trend indicators point towards a bearish sentiment in the short term, with the moving averages and MACD signaling potential downward pressure on the stock price.
- Momentum: The momentum indicators show a mixed picture, with the Stochastic Oscillator hinting at a possible bullish reversal while the RSI remains neutral.
- Volatility: Volatility has been decreasing, indicating a period of consolidation or sideways movement in the stock price.
- Volume: The volume indicators suggest a lack of strong buying or selling pressure, leading to a relatively balanced market sentiment.
Conclusion:
Based on the analysis of the technical indicators, the next few days for OPRA could see sideways movement with a slight bearish bias. Traders may expect the stock price to consolidate within a range, potentially testing support levels. It is advisable to closely monitor key levels and wait for clearer signals before making significant trading decisions.