Technical Analysis of OKYO 2024-05-10
Overview:
In analyzing the technical indicators for OKYO stock over the last 5 days, we will delve into the trend, momentum, volatility, and volume indicators to provide a comprehensive outlook on the possible stock price movement in the coming days. By examining these key aspects, we aim to offer valuable insights and predictions to guide investment decisions.
Trend Analysis:
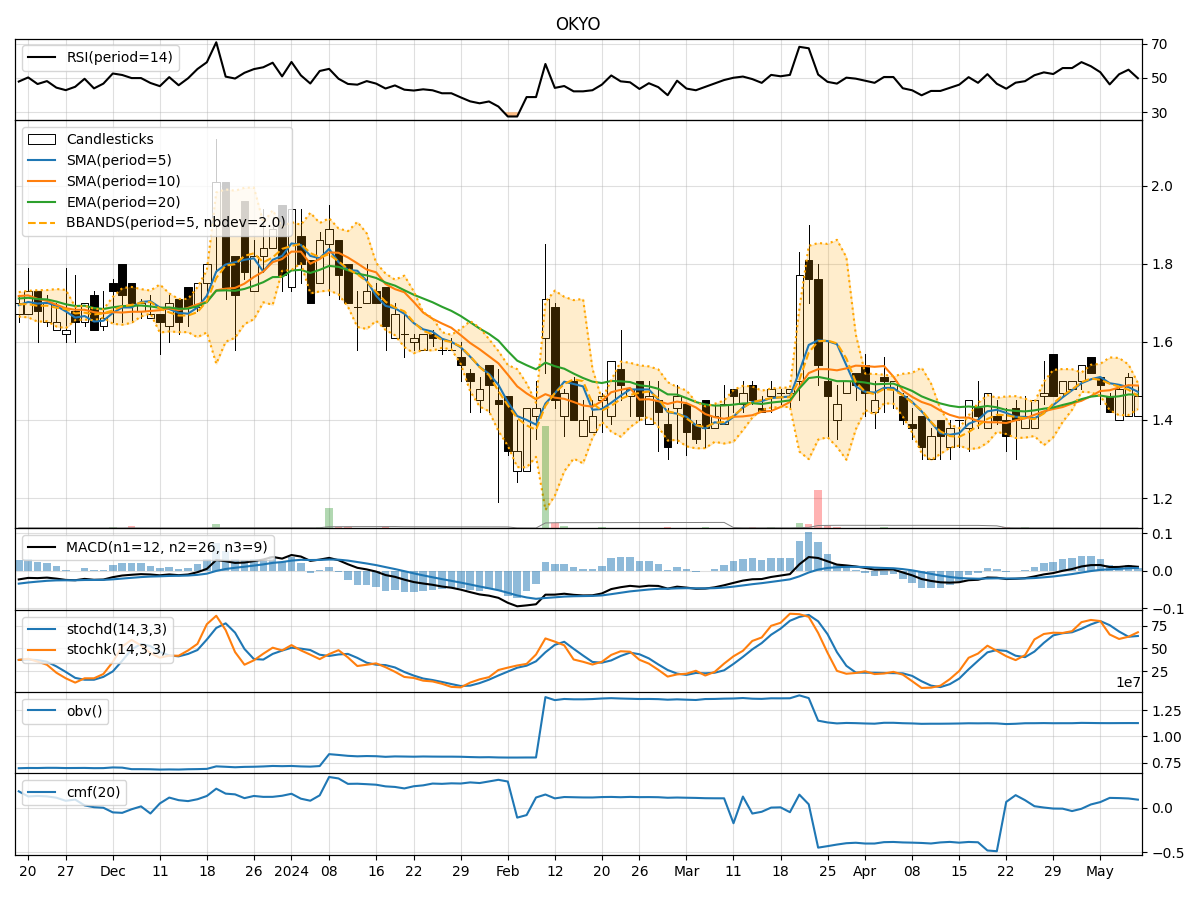
- Moving Averages (MA): The 5-day Moving Average (MA) has been fluctuating around the current stock price, indicating a lack of clear trend direction.
- MACD: The Moving Average Convergence Divergence (MACD) has shown slight positive values, suggesting a potential bullish momentum.
- EMA: The Exponential Moving Average (EMA) has been relatively stable, reflecting a neutral trend.
Key Observation: The trend indicators suggest a mixed outlook with no strong directional bias.
Momentum Analysis:
- RSI: The Relative Strength Index (RSI) has been hovering around the mid-level, indicating a balanced momentum.
- Stochastic Oscillator: Both %K and %D values have shown fluctuations but have not reached extreme levels, suggesting a neutral momentum.
- Williams %R: The Williams %R is also within a neutral range, indicating no extreme buying or selling pressure.
Key Observation: Momentum indicators point towards a lack of significant momentum in either direction.
Volatility Analysis:
- Bollinger Bands (BB): The Bollinger Bands have shown narrowing bands, indicating decreasing volatility.
Key Observation: Volatility has been decreasing, potentially signaling a period of consolidation or a forthcoming breakout.
Volume Analysis:
- On-Balance Volume (OBV): The OBV has been relatively stable, indicating a balance between buying and selling pressure.
- Chaikin Money Flow (CMF): The CMF has shown a slight decline but remains positive, suggesting a moderate inflow of money into the stock.
Key Observation: Volume indicators suggest a balanced market sentiment with no clear dominance of buyers or sellers.
Conclusion:
Based on the analysis of the technical indicators, the stock price of OKYO is likely to experience sideways movement in the coming days. The lack of strong trends in the trend and momentum indicators, coupled with decreasing volatility and balanced volume, indicates a period of consolidation. Investors may expect the stock price to trade within a narrow range without significant upward or downward movements.
Key Conclusion: Sideways movement is anticipated for OKYO stock in the near term.