Technical Analysis of OGI 2024-05-10
Overview:
In analyzing the technical indicators for OGI over the last 5 days, we will delve into the trend, momentum, volatility, and volume indicators to provide a comprehensive outlook on the possible stock price movement. By examining these key aspects, we aim to offer valuable insights and predictions for the upcoming days.
Trend Analysis:
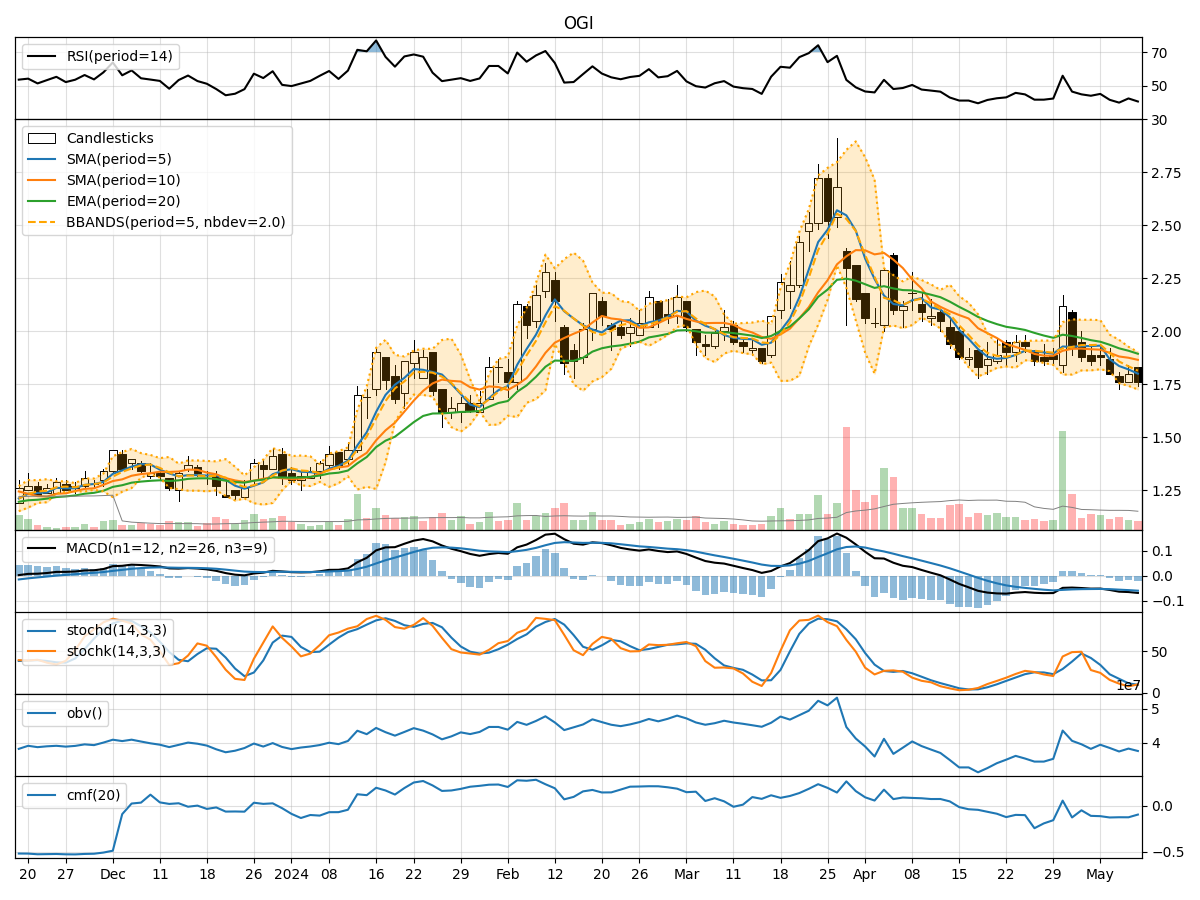
- Moving Averages (MA): The 5-day MA has been consistently below the closing price, indicating a downward trend.
- MACD: The MACD line has been negative, with the MACD histogram showing a decreasing trend, signaling bearish momentum.
Momentum Analysis:
- RSI: The RSI has been hovering around 40-45, indicating a neutral to slightly bearish momentum.
- Stochastic Oscillator: Both %K and %D have been in oversold territory, suggesting a potential reversal or consolidation phase.
Volatility Analysis:
- Bollinger Bands (BB): The stock price has been trading within the lower Bollinger Band, indicating lower volatility.
Volume Analysis:
- On-Balance Volume (OBV): The OBV has been declining, suggesting selling pressure in the stock.
- Chaikin Money Flow (CMF): The CMF has been negative, indicating a lack of buying interest.
Key Observations:
- The stock is in a downtrend based on moving averages and MACD.
- Momentum indicators suggest a neutral to slightly bearish sentiment.
- Volatility is low, as indicated by the Bollinger Bands.
- Volume indicators show selling pressure with a negative OBV and CMF.
Conclusion:
Based on the technical analysis of OGI, the stock is likely to continue its downward movement in the near term. Traders should exercise caution as the momentum remains weak, and selling pressure persists. It is advisable to wait for a clear reversal signal or a significant change in the technical indicators before considering any long positions. The stock is currently in a bearish phase, and investors should closely monitor key support levels for potential entry points or trend reversal signals.