Technical Analysis of ODFL 2024-05-10
Overview:
In analyzing the technical indicators for ODFL over the last 5 days, we will delve into the trend, momentum, volatility, and volume indicators to provide a comprehensive outlook on the possible stock price movement in the coming days. By examining these key indicators, we aim to offer valuable insights and predictions for informed decision-making.
Trend Analysis:
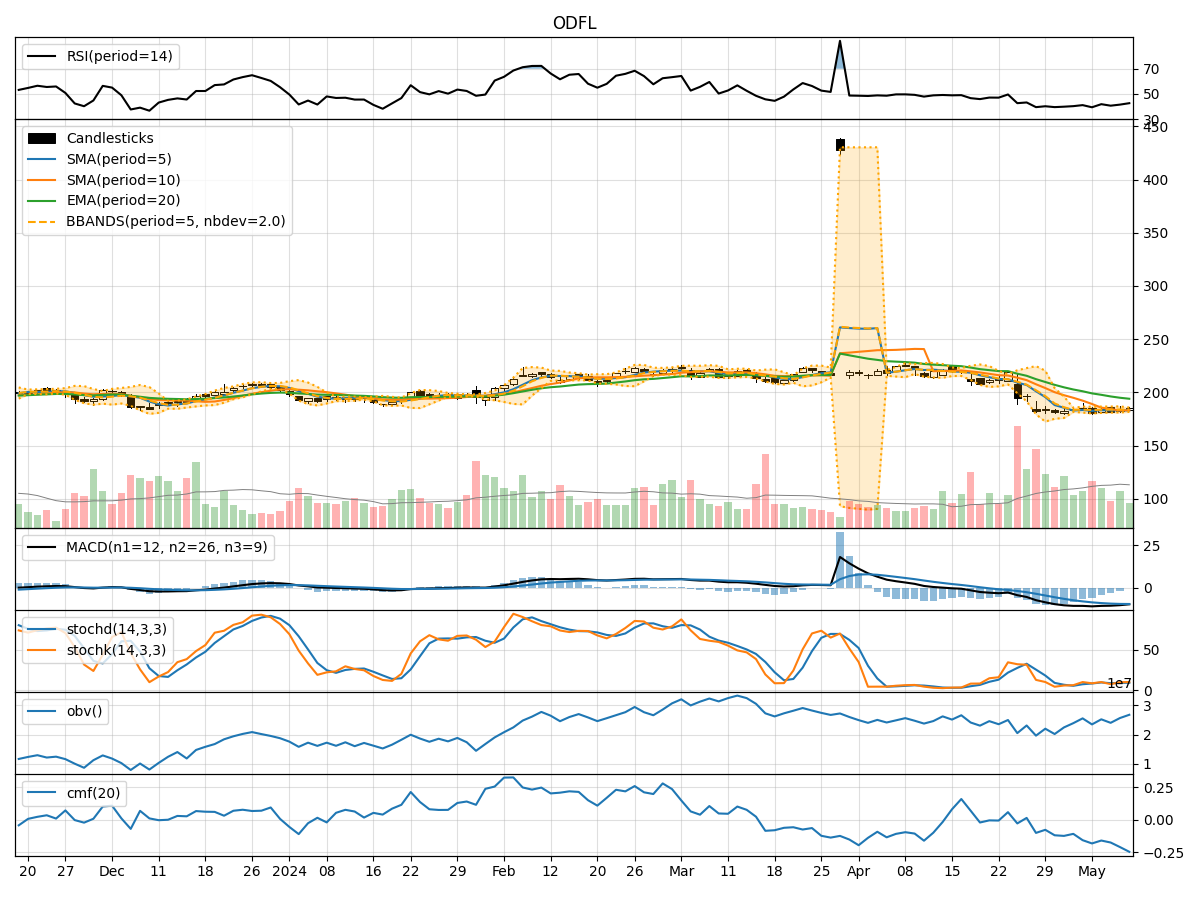
- Moving Averages (MA): The 5-day Moving Average (MA) is below the Simple Moving Average (SMA) and Exponential Moving Average (EMA), indicating a bearish trend.
- MACD: The MACD line is below the signal line, with a negative MACD histogram, suggesting a bearish momentum.
Momentum Analysis:
- RSI: The Relative Strength Index (RSI) is below 50, indicating bearish momentum.
- Stochastic Oscillator: Both %K and %D are below 20, signaling an oversold condition.
- Williams %R: The Williams %R is below -80, suggesting an oversold market.
Volatility Analysis:
- Bollinger Bands (BB): The price is currently below the middle Bollinger Band, indicating a bearish sentiment.
- Bollinger %B: The %B is below 1, suggesting the stock is trading at the lower band, indicating a bearish trend.
Volume Analysis:
- On-Balance Volume (OBV): The OBV has been fluctuating, indicating indecision in the market.
- Chaikin Money Flow (CMF): The CMF is negative, suggesting bearish money flow.
Key Observations:
- The trend indicators, momentum oscillators, and volatility indicators all point towards a bearish sentiment in the market.
- The stock is currently in an oversold condition based on the Stochastic Oscillator and Williams %R.
- The volume indicators show mixed signals, with OBV fluctuating and CMF indicating bearish money flow.
Conclusion:
Based on the analysis of the technical indicators, the next few days' possible stock price movement for ODFL is likely to be downward. The bearish trend, momentum, and volatility signals, coupled with the oversold conditions, suggest a potential continuation of the current downtrend. Traders and investors should exercise caution and consider waiting for signs of a reversal before considering long positions.