Technical Analysis of ODD 2024-05-10
Overview:
In analyzing the provided technical indicators for the last 5 days, we will delve into the trend, momentum, volatility, and volume indicators to forecast the possible stock price movement for the next few days. By examining these key aspects, we aim to provide a comprehensive and insightful prediction backed by data-driven analysis.
Trend Indicators:
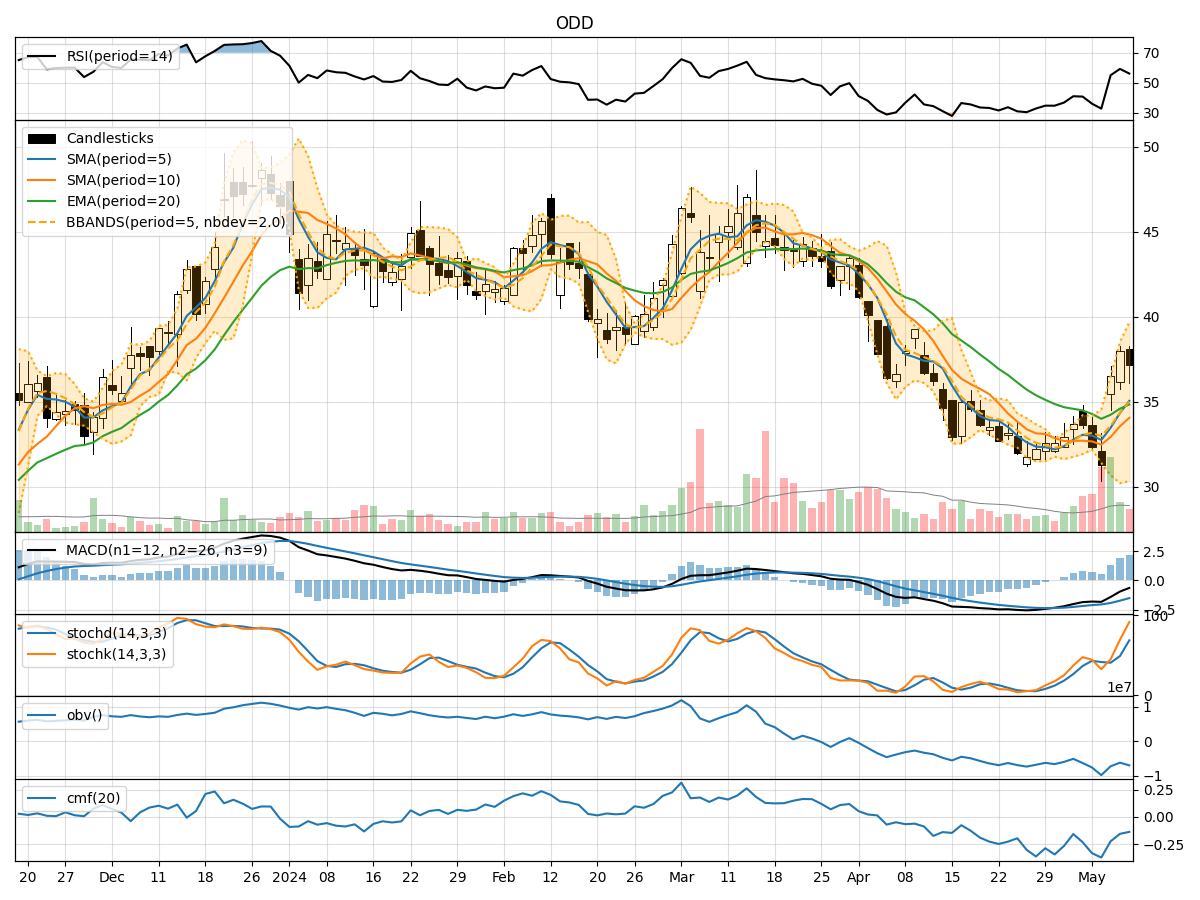
- Moving Averages (MA): The 5-day moving average (MA) has been fluctuating, indicating some volatility in the short term.
- MACD: The Moving Average Convergence Divergence (MACD) has shown a positive trend, with the MACD line consistently above the signal line.
- EMA: The Exponential Moving Average (EMA) has been relatively stable, suggesting a smoother trend over the longer term.
Momentum Indicators:
- RSI: The Relative Strength Index (RSI) has shown mixed signals, hovering around the neutral zone, indicating indecision in the market.
- Stochastic Oscillator: The Stochastic Oscillator has been fluctuating, showing potential overbought conditions in the recent period.
- Williams %R: The Williams %R indicator has been in the oversold territory, hinting at a possible reversal in the near future.
Volatility Indicators:
- Bollinger Bands: The Bollinger Bands have widened, indicating increased volatility in the stock price.
- Volatility Percentage: The volatility percentage has been relatively high, suggesting significant price fluctuations.
Volume Indicators:
- On-Balance Volume (OBV): The OBV has shown a slight decline, indicating some selling pressure in the market.
- Chaikin Money Flow (CMF): The CMF has been negative, signaling a lack of buying interest in the stock.
Key Observations:
- The trend indicators suggest a mixed outlook, with some short-term volatility but a positive longer-term trend.
- Momentum indicators indicate indecision in the market, with potential overbought conditions.
- Volatility indicators point towards increased price fluctuations and uncertainty.
- Volume indicators reflect a slight decline in buying interest and some selling pressure.
Conclusion:
Based on the analysis of the technical indicators, the stock is likely to experience sideways movement in the next few days. The mixed signals from trend and momentum indicators, coupled with increased volatility and lackluster volume, suggest a period of consolidation. Traders should exercise caution and wait for clearer signals before making significant trading decisions.