Technical Analysis of OCUL 2024-05-10
Overview:
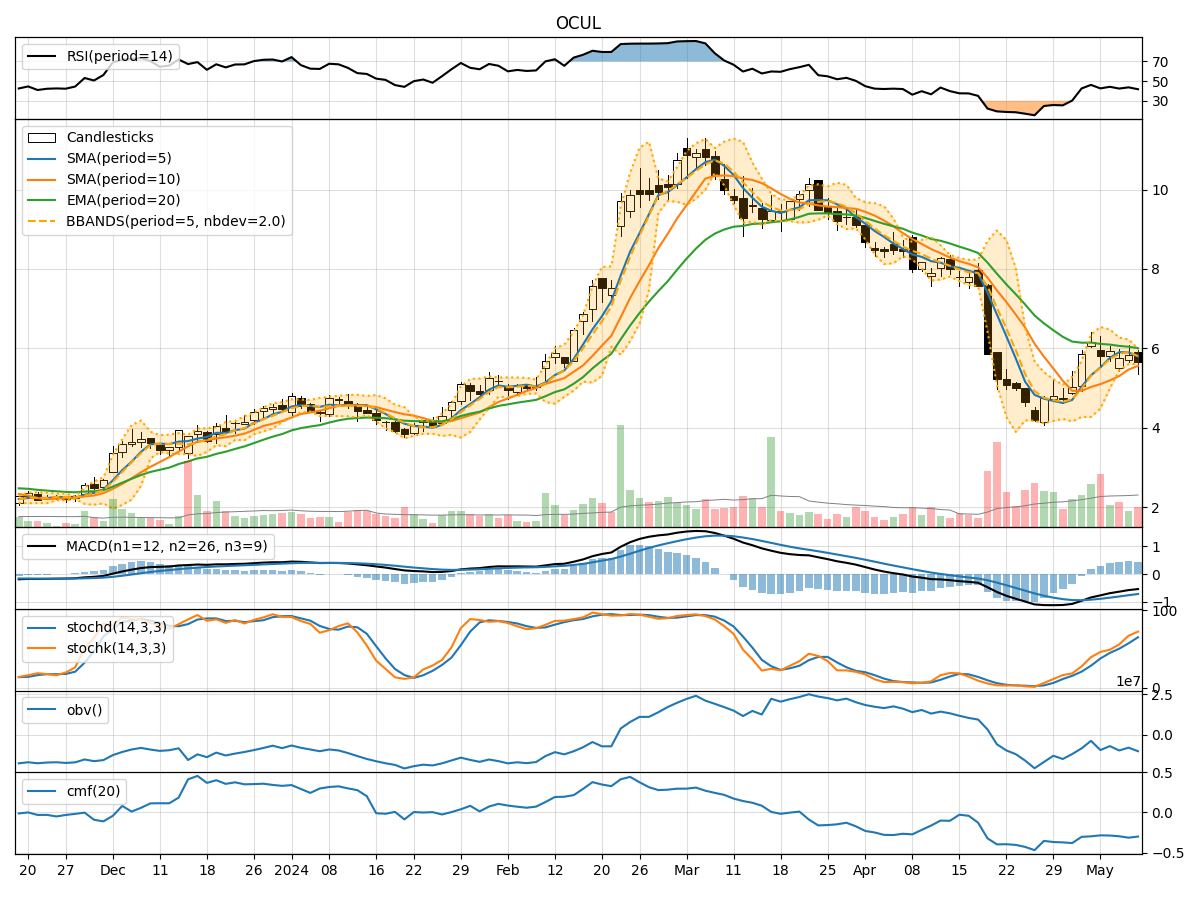
In analyzing the technical indicators for OCUL over the last 5 days, we will delve into the trend, momentum, volatility, and volume indicators to provide a comprehensive outlook on the possible stock price movement in the coming days. By examining these key aspects, we aim to offer valuable insights and recommendations for your investment decisions.
Trend Analysis:
- Moving Averages (MA): The 5-day Moving Average (MA) has been fluctuating around the closing prices, indicating short-term price trends. The Simple Moving Average (SMA) and Exponential Moving Average (EMA) show a gradual decline, suggesting a bearish trend.
- MACD: The Moving Average Convergence Divergence (MACD) has been negative, with the MACD line consistently below the signal line. This indicates a bearish momentum in the stock price.
- Conclusion: The trend indicators point towards a bearish outlook for OCUL in the near term.
Momentum Analysis:
- RSI: The Relative Strength Index (RSI) has been hovering around the mid-range, indicating a lack of strong momentum in either direction.
- Stochastic Oscillator: Both %K and %D lines of the Stochastic Oscillator have been in the overbought zone, suggesting a potential reversal in price direction.
- Conclusion: The momentum indicators suggest a neutral stance with a slight bearish bias.
Volatility Analysis:
- Bollinger Bands (BB): The Bollinger Bands have been narrowing, indicating decreasing volatility in the stock price. The bands are currently close to the lower limit, suggesting a potential price reversal.
- Conclusion: Volatility indicators signal a potential price reversal or a period of consolidation.
Volume Analysis:
- On-Balance Volume (OBV): The OBV has been fluctuating, indicating mixed buying and selling pressure. The Chaikin Money Flow (CMF) is negative, reflecting a net outflow of money from the stock.
- Conclusion: Volume indicators suggest a lack of strong buying interest in the stock.
Overall Conclusion:
Based on the analysis of trend, momentum, volatility, and volume indicators, the overall outlook for OCUL in the next few days is bearish with a potential for price reversal or consolidation. Traders should exercise caution and consider waiting for more definitive signals before making any significant trading decisions. It is advisable to closely monitor key support and resistance levels for potential entry or exit points.
Key Recommendations:
- Short-term Traders: Consider shorting the stock or adopting a wait-and-see approach for clearer signals.
- Long-term Investors: Monitor the price action closely and wait for a more favorable entry point before considering any long-term positions.
- Risk Management: Implement strict stop-loss orders to mitigate potential losses in case of adverse price movements.
In conclusion, while the technical indicators suggest a bearish bias for OCUL in the near term, it is essential to remain vigilant and adapt to changing market conditions. Conducting further analysis and staying informed about market developments will be crucial in navigating potential price fluctuations effectively.