Technical Analysis of OCS 2024-05-10
Overview:
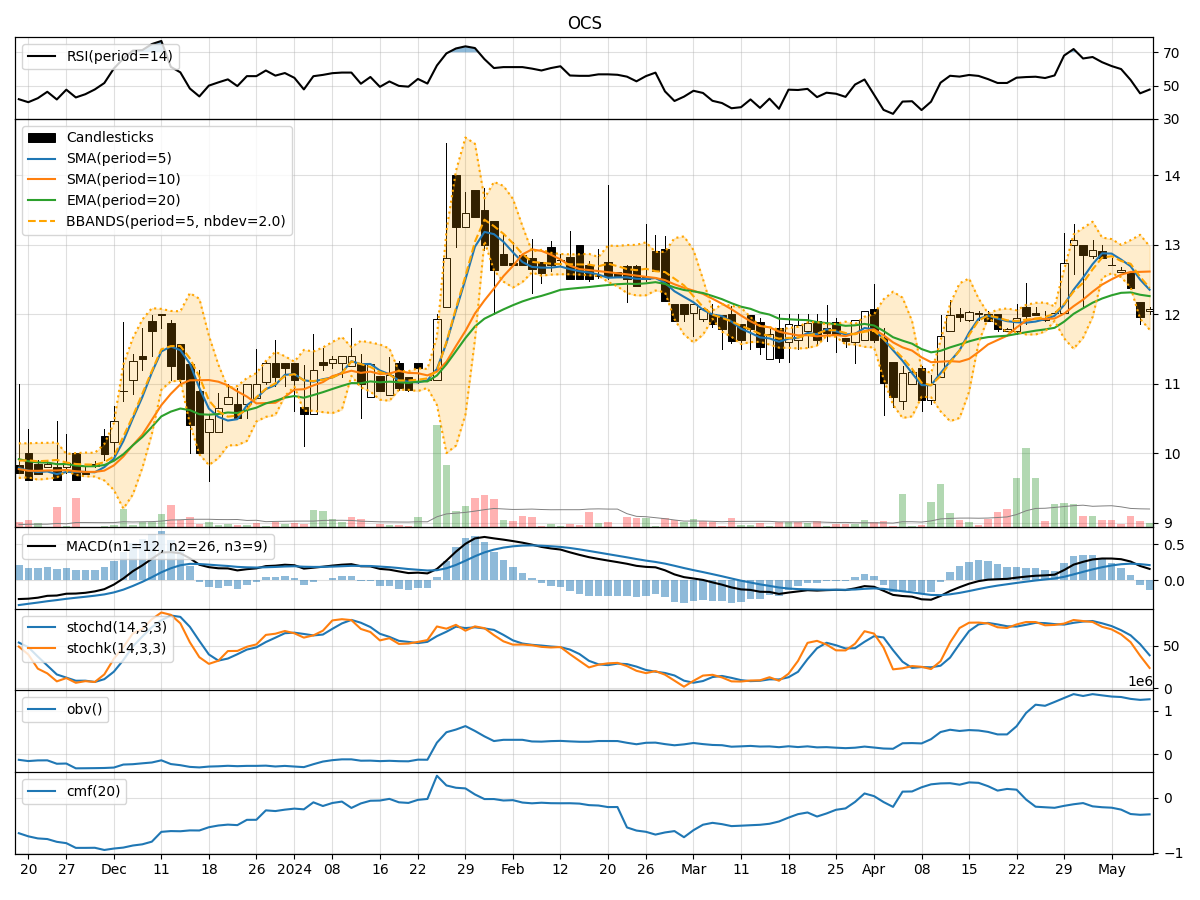
In analyzing the technical indicators for OCS stock over the last 5 days, we will delve into the trend, momentum, volatility, and volume indicators to provide a comprehensive outlook on the possible stock price movement in the coming days.
Trend Analysis:
- Moving Averages (MA): The 5-day Moving Average (MA) has been declining, indicating a short-term bearish trend.
- MACD: The MACD line has been decreasing, with the MACD line crossing below the signal line, signaling a bearish trend.
- RSI: The Relative Strength Index (RSI) has been declining, suggesting weakening momentum.
Momentum Analysis:
- Stochastic Oscillator: Both %K and %D have been decreasing, indicating a bearish momentum.
- Williams %R: The Williams %R is in oversold territory, suggesting a potential reversal or continuation of the downtrend.
Volatility Analysis:
- Bollinger Bands (BB): The stock price has been trading below the lower Bollinger Band, indicating oversold conditions.
- BB Width: The Bollinger Band width has been widening, suggesting increased volatility.
Volume Analysis:
- On-Balance Volume (OBV): The OBV has been declining, indicating selling pressure.
- Chaikin Money Flow (CMF): The CMF has been negative, indicating a bearish money flow.
Key Observations and Opinions:
- The trend indicators, momentum indicators, and volume indicators all point towards a bearish sentiment in the stock.
- The stock is currently oversold based on the Williams %R and Bollinger Bands, suggesting a potential bounce or reversal.
- The increasing volatility, declining OBV, and negative CMF further support the bearish outlook.
Conclusion:
Based on the analysis of the technical indicators, the next few days' possible stock price movement for OCS is likely to be downward. The bearish trend, momentum, and volume signals indicate a high probability of further price decline. Traders and investors should exercise caution and consider shorting or staying on the sidelines until a clear reversal pattern emerges.