Technical Analysis of OCG 2024-05-10
Overview:
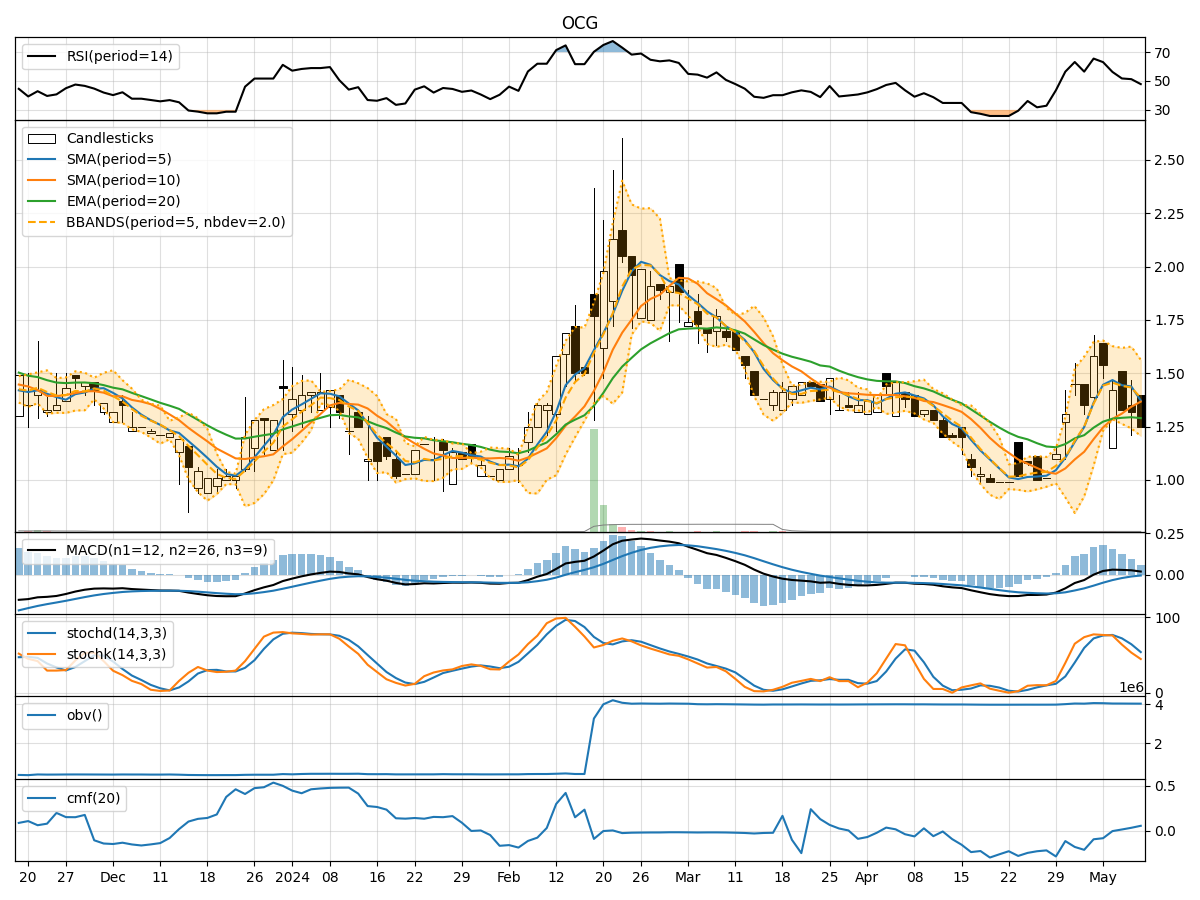
In the last 5 trading days, OCG stock has shown a mixed performance with fluctuations in price and volume. The technical indicators across trend, momentum, volatility, and volume provide valuable insights into the stock's potential future movements. Let's analyze each category of indicators to determine the possible next few days' stock price movement.
Trend Analysis:
- Moving Averages (MA): The 5-day MA has been fluctuating, indicating short-term price volatility.
- MACD: The MACD line has been positive, but the MACD Histogram has been decreasing, suggesting a potential weakening of the bullish momentum.
- RSI: The RSI has been fluctuating around the 50 level, indicating indecision in the market sentiment.
Momentum Analysis:
- Stochastic Oscillator: The Stochastic Oscillator has been declining, indicating a potential bearish momentum.
- Williams %R (WillR): The Williams %R has been in oversold territory, suggesting a possible reversal in the short term.
Volatility Analysis:
- Bollinger Bands (BB): The Bollinger Bands have been narrowing, indicating decreasing volatility.
- BB %B (BBP): The %B has been relatively low, suggesting a potential oversold condition.
Volume Analysis:
- On-Balance Volume (OBV): The OBV has been relatively flat, indicating a balance between buying and selling pressure.
- Chaikin Money Flow (CMF): The CMF has been slightly positive, indicating some buying pressure.
Key Observations:
- The stock is currently in a consolidation phase with mixed signals from different indicators.
- The decreasing MACD Histogram and declining Stochastic Oscillator suggest a potential bearish bias.
- The narrowing Bollinger Bands and oversold Williams %R indicate a possible reversal or consolidation in the short term.
Conclusion:
Based on the analysis of technical indicators, the next few days' possible stock price movement for OCG is sideways to slightly bearish. Traders should exercise caution and closely monitor key levels such as support and resistance for potential entry or exit points. It is advisable to wait for more confirmation from the indicators before taking significant trading positions.