Technical Analysis of NWS 2024-05-10
Overview:
In analyzing the technical indicators for NWS over the last 5 days, we will delve into the trend, momentum, volatility, and volume indicators to provide a comprehensive outlook on the possible stock price movement in the coming days.
Trend Analysis:
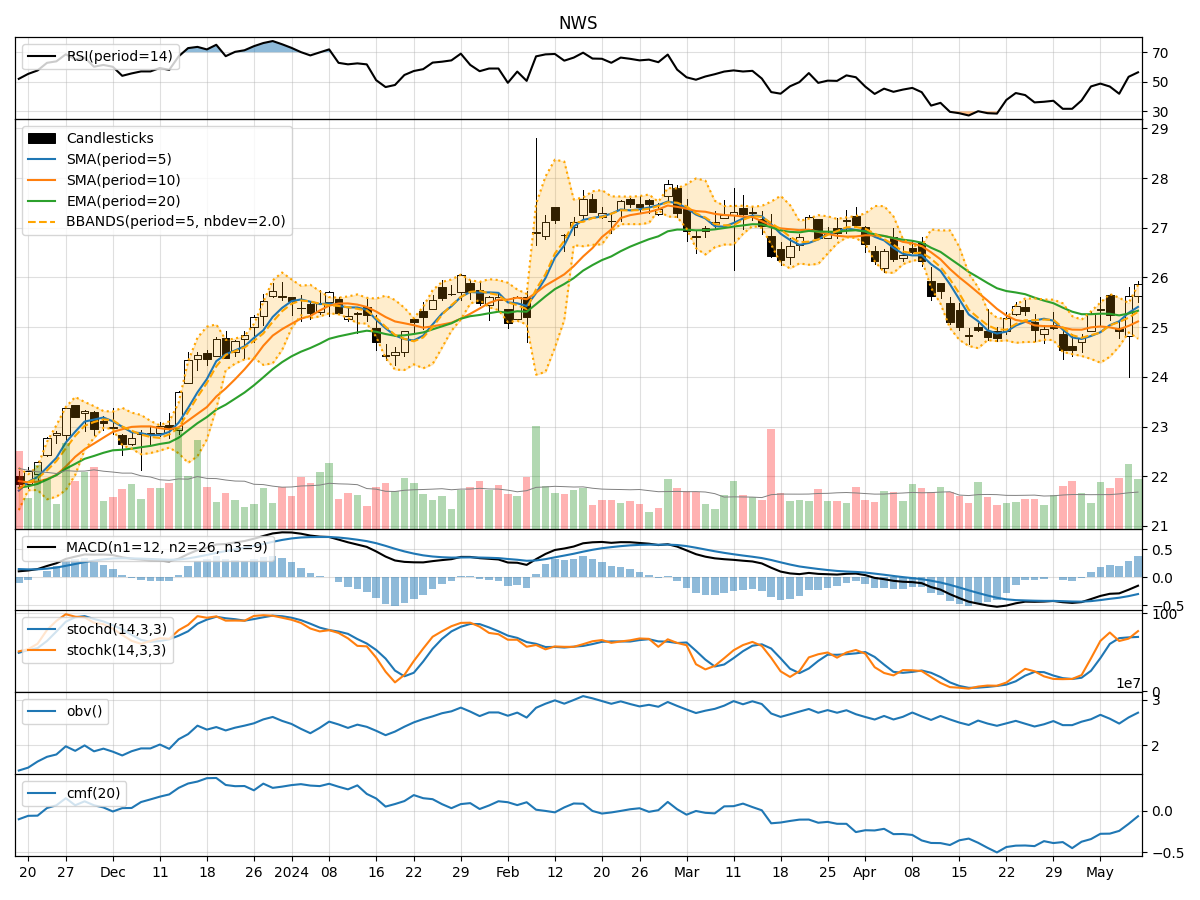
- Moving Averages (MA): The 5-day MA has been showing an upward trend, indicating a positive momentum in the stock price.
- MACD: The MACD line has been consistently below the signal line, suggesting a bearish trend in the short term.
- EMA: The EMA has been relatively stable, indicating a potential consolidation phase in the stock price.
Momentum Analysis:
- RSI: The RSI has been fluctuating around the neutral zone, indicating indecision in the market.
- Stochastic Oscillator: Both %K and %D have been in the overbought territory, signaling a potential reversal in the stock price.
- Williams %R: The Williams %R has been hovering near oversold levels, suggesting a possible buying opportunity.
Volatility Analysis:
- Bollinger Bands (BB): The bands have been narrowing, indicating decreasing volatility and a potential breakout in the stock price.
- Bollinger %B: The %B indicator has been fluctuating within a range, suggesting a period of consolidation.
Volume Analysis:
- On-Balance Volume (OBV): The OBV has been mixed, indicating a divergence between price and volume movements.
- Chaikin Money Flow (CMF): The CMF has been negative, suggesting selling pressure in the stock.
Key Observations:
- The trend indicators show a mixed signal with a slight bullish bias from the moving averages.
- Momentum indicators suggest a potential reversal in the stock price due to overbought conditions.
- Volatility indicators point towards a period of consolidation and a possible breakout.
- Volume indicators indicate a divergence between price and volume movements, signaling uncertainty in the market sentiment.
Conclusion:
Based on the analysis of the technical indicators, the stock price of NWS is likely to experience sideways consolidation in the coming days. The mixed signals from the trend, momentum, volatility, and volume indicators suggest a period of indecision in the market. Traders should exercise caution and wait for a clearer trend to emerge before making any significant trading decisions.