Technical Analysis of NVMI 2024-05-10
Overview:
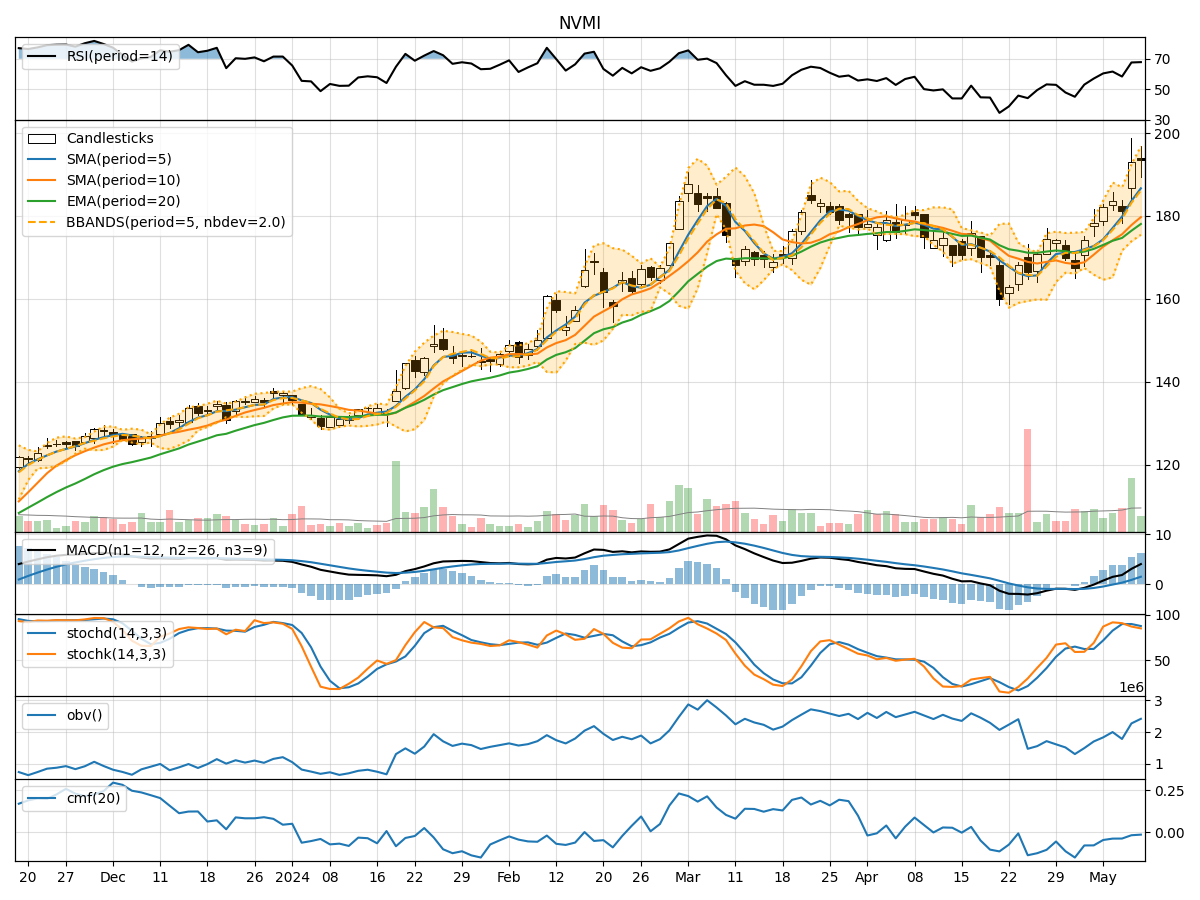
In analyzing the technical indicators for NVMI over the last 5 days, we will delve into the trend, momentum, volatility, and volume indicators to provide a comprehensive outlook on the possible stock price movement in the coming days.
Trend Analysis:
- Moving Averages (MA): The 5-day Moving Average (MA) has been consistently rising, indicating a bullish trend in the short term.
- MACD: The MACD line has been above the signal line for the past few days, suggesting bullish momentum.
- EMA: The Exponential Moving Average (EMA) has also been trending upwards, supporting the bullish sentiment.
Momentum Analysis:
- RSI: The Relative Strength Index (RSI) has been in the overbought territory, indicating strong buying momentum.
- Stochastic Oscillator: Both %K and %D have been relatively high, suggesting an overbought condition.
- Williams %R: The Williams %R is also in the oversold region, signaling a potential reversal.
Volatility Analysis:
- Bollinger Bands: The stock price has been trading near the upper Bollinger Band, indicating high volatility and a potential overbought condition.
- Bollinger %B: The %B indicator is above 0.8, suggesting that the stock is trading at the upper end of its recent price range.
Volume Analysis:
- On-Balance Volume (OBV): The OBV has shown mixed signals, with some days seeing an increase in volume and others experiencing a decrease.
- Chaikin Money Flow (CMF): The CMF has been negative, indicating selling pressure in the stock.
Key Observations:
- The trend indicators suggest a strong bullish sentiment in the short term.
- Momentum indicators point towards a potential overbought condition, signaling a need for caution.
- Volatility indicators highlight high price fluctuations and a possible overbought scenario.
- Volume indicators show mixed signals, with no clear trend in volume accumulation.
Conclusion:
Based on the analysis of the technical indicators, the stock is currently in an overbought condition with strong bullish momentum. However, the high volatility and mixed volume signals suggest a potential consolidation or pullback in the near future. Traders should exercise caution and consider taking profits or implementing risk management strategies. A short-term correction or consolidation phase is likely, followed by a potential continuation of the bullish trend if key support levels hold.