Technical Analysis of NTES 2024-05-10
Overview:
In analyzing the technical indicators for NTES over the last 5 days, we will delve into the trend, momentum, volatility, and volume indicators to provide a comprehensive outlook on the possible stock price movement in the coming days. By examining these key factors, we aim to offer valuable insights and predictions for potential investors.
Trend Analysis:
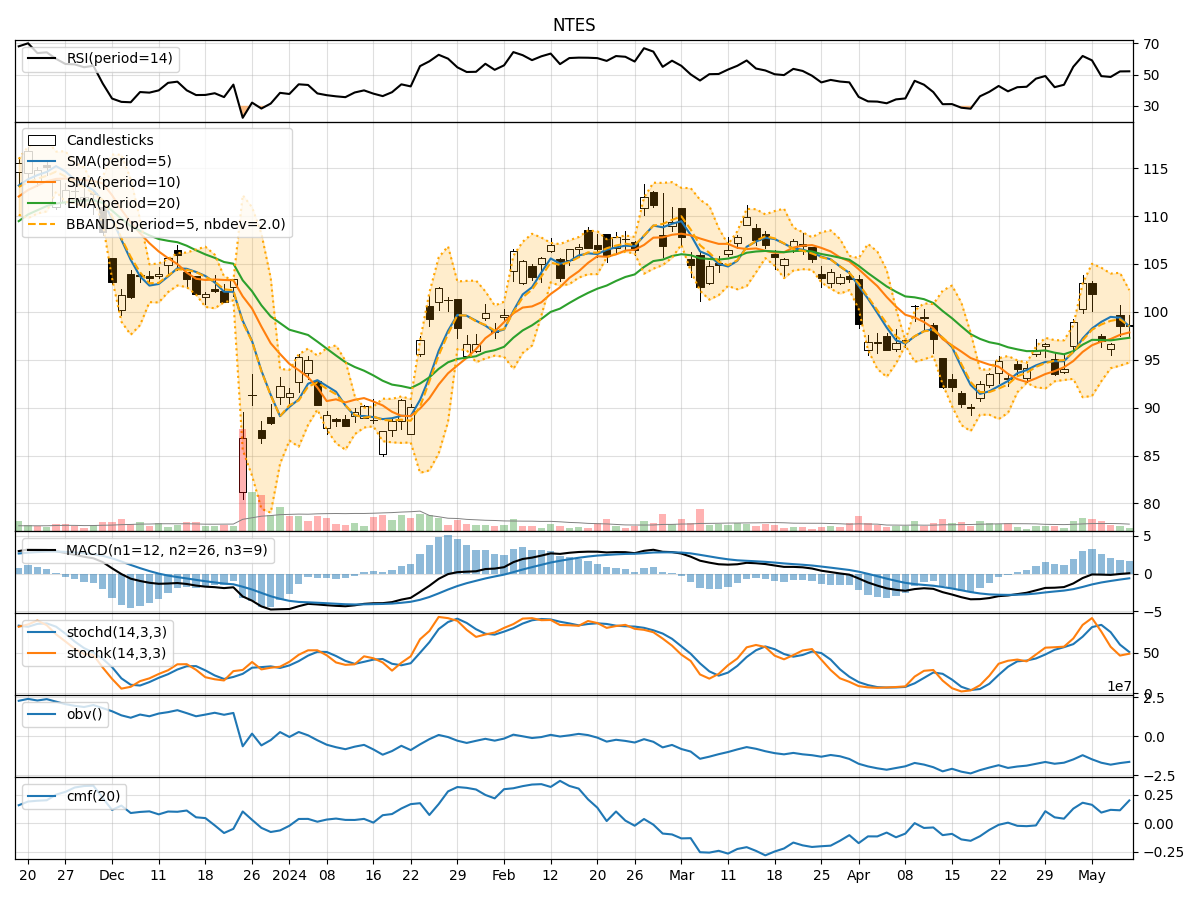
- Moving Averages (MA): The 5-day MA has been fluctuating around the closing prices, indicating short-term price trends. The SMA(10) and EMA(20) have shown a slight upward trend, suggesting a potential bullish sentiment.
- MACD: The MACD line has been hovering around the signal line, indicating a neutral stance in the short term. The MACD Histogram has been decreasing, signaling a potential bearish crossover.
Momentum Analysis:
- RSI: The RSI has been fluctuating around the 50 level, indicating a lack of strong momentum in either direction.
- Stochastic Oscillator: Both %K and %D have been moving towards the oversold territory, suggesting a potential reversal in the short term.
- Williams %R: The indicator has been hovering around the oversold region, indicating a possible buying opportunity.
Volatility Analysis:
- Bollinger Bands: The bands have been narrowing, indicating decreasing volatility in the stock price. This could signal a period of consolidation or a potential breakout in the near future.
Volume Analysis:
- On-Balance Volume (OBV): The OBV has been declining, suggesting a decrease in buying pressure over the last few days.
- Chaikin Money Flow (CMF): The CMF has been relatively stable, indicating a neutral stance in terms of money flow.
Key Observations:
- The trend indicators suggest a potential bullish sentiment in the short term, supported by the moving averages.
- Momentum indicators show a lack of strong momentum, with oscillators nearing oversold levels.
- Volatility has been decreasing, indicating a period of consolidation.
- Volume indicators point towards a decrease in buying pressure.
Conclusion:
Based on the analysis of the technical indicators, the stock price of NTES is likely to experience sideways movement in the coming days. The bullish sentiment indicated by the trend indicators may be limited due to the lack of strong momentum and decreasing buying pressure. Traders should exercise caution and wait for clearer signals before making significant trading decisions.