Technical Analysis of NSPR 2024-05-10
Overview:
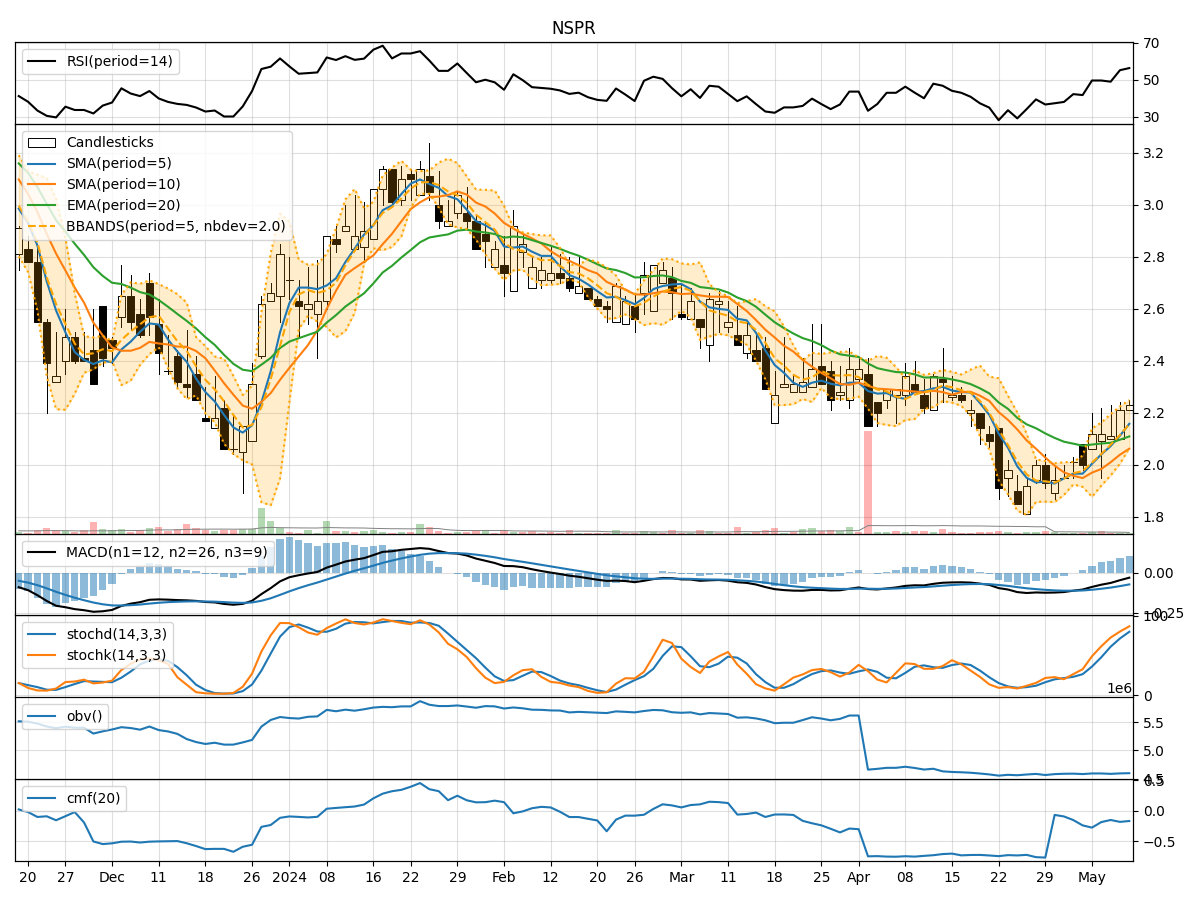
In analyzing the technical indicators for NSPR over the last 5 days, we will delve into the trend, momentum, volatility, and volume indicators to provide a comprehensive assessment of the stock's potential price movement. By examining these key factors, we aim to offer valuable insights and predictions for the next few days.
Trend Analysis:
- Moving Averages (MA): The 5-day Moving Average (MA) has been consistently above the closing prices, indicating a bullish trend.
- MACD: The MACD line has been negative but showing signs of convergence with the signal line, suggesting a potential reversal in the trend.
- EMA: The Exponential Moving Average (EMA) has been gradually increasing, supporting the bullish sentiment.
Momentum Analysis:
- RSI: The Relative Strength Index (RSI) has been hovering around the neutral zone, indicating a balanced momentum.
- Stochastic Oscillator: Both %K and %D have been in the overbought territory, suggesting a potential pullback.
- Williams %R: The Williams %R is close to the oversold region, indicating a possible reversal in momentum.
Volatility Analysis:
- Bollinger Bands (BB): The stock price has been trading within the Bollinger Bands, suggesting a period of consolidation.
- BB Width: The Bollinger Bands width has been narrowing, indicating decreasing volatility.
- BB %B: The %B indicator is close to 1, signaling a potential reversal or consolidation phase.
Volume Analysis:
- On-Balance Volume (OBV): The OBV has been slightly decreasing, indicating some distribution of the stock.
- Chaikin Money Flow (CMF): The CMF has been negative, suggesting outflows from the stock.
Conclusion:
Based on the analysis of the technical indicators, the stock is likely to experience sideways movement in the next few days. The trend indicators show a potential bullish bias, supported by the moving averages and EMA. However, the momentum indicators suggest a possible pullback in the short term due to overbought conditions. Volatility is decreasing, indicating a period of consolidation, while volume indicators point towards some distribution.
Recommendation:
Considering the overall technical picture, it is advisable to exercise caution in trading NSPR in the near future. Traders may consider waiting for a clearer signal before taking any significant positions. Keep a close eye on the momentum indicators for potential reversals and monitor the volume for any significant shifts in market sentiment.