Technical Analysis of NNDM 2024-05-10
Overview:
In analyzing the technical indicators for NNDM over the last 5 days, we will delve into the trend, momentum, volatility, and volume indicators to provide a comprehensive outlook on the possible stock price movement. By examining these key aspects, we aim to offer valuable insights and predictions for the upcoming days.
Trend Analysis:
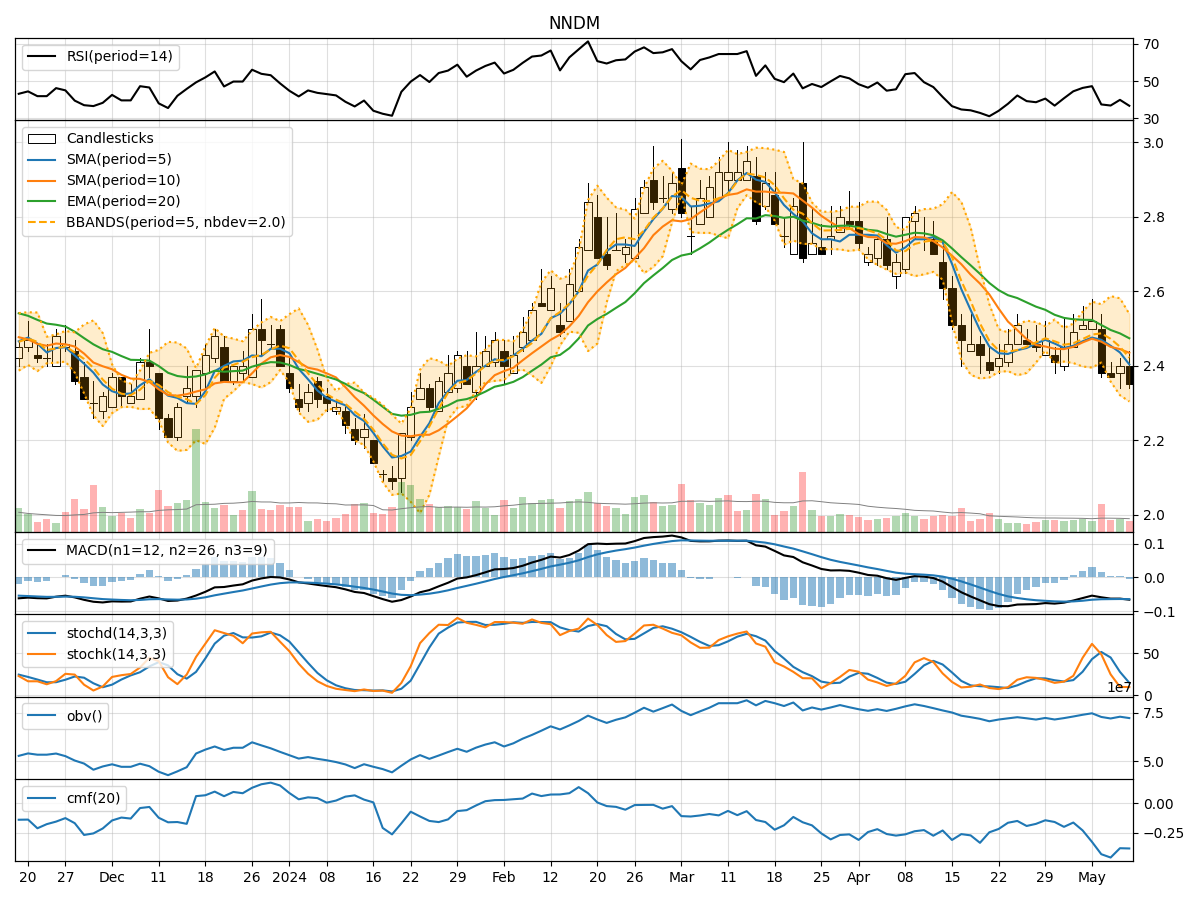
- Moving Averages (MA): The 5-day MA has been fluctuating around the closing prices, indicating a lack of clear trend direction.
- MACD: The MACD line has been consistently negative, suggesting a bearish momentum in the short term.
- RSI: The RSI values have been hovering around the mid-range, reflecting a neutral sentiment among traders.
Key Observation: The trend indicators point towards a lack of strong trend direction, with a slight bearish bias indicated by the MACD.
Momentum Analysis:
- Stochastic Oscillator: Both %K and %D values have been declining, indicating weakening momentum.
- Williams %R: The values have been consistently in the oversold territory, signaling a potential reversal.
Key Observation: Momentum indicators suggest a bearish momentum with signs of potential reversal in the near future.
Volatility Analysis:
- Bollinger Bands (BB): The bands have been narrowing, indicating decreasing volatility.
- BB %B: The %B values have been fluctuating within a tight range, reflecting stable volatility levels.
Key Observation: Volatility indicators suggest a period of low volatility and potential consolidation in the stock price.
Volume Analysis:
- On-Balance Volume (OBV): The OBV values have been fluctuating, indicating indecision among market participants.
- Chaikin Money Flow (CMF): The CMF values have been negative, suggesting outflow of money from the stock.
Key Observation: Volume indicators reflect a lack of strong buying interest and a negative money flow sentiment.
Conclusion:
Based on the analysis of the technical indicators, the stock price of NNDM is likely to experience further downward movement in the coming days. The trend indicators show a lack of clear direction, with a slight bearish bias. Momentum indicators suggest a bearish momentum with signs of a potential reversal, while volatility indicators point towards low volatility and possible consolidation. Volume indicators indicate a lack of strong buying interest and negative money flow sentiment.
Recommendation:
Considering the overall technical outlook, it is advisable to exercise caution and closely monitor the stock price movement. Traders may consider short-term bearish strategies or wait for more clarity in the trend direction before making any significant investment decisions. It is essential to set stop-loss levels and adhere to risk management practices to mitigate potential losses.