Technical Analysis of NLSP 2024-05-10
Overview:
In analyzing the technical indicators for NLSP stock over the last 5 days, we will delve into the trend, momentum, volatility, and volume indicators to provide a comprehensive outlook on the possible stock price movement in the coming days. By examining these key indicators, we aim to offer valuable insights and predictions for potential investors.
Trend Analysis:
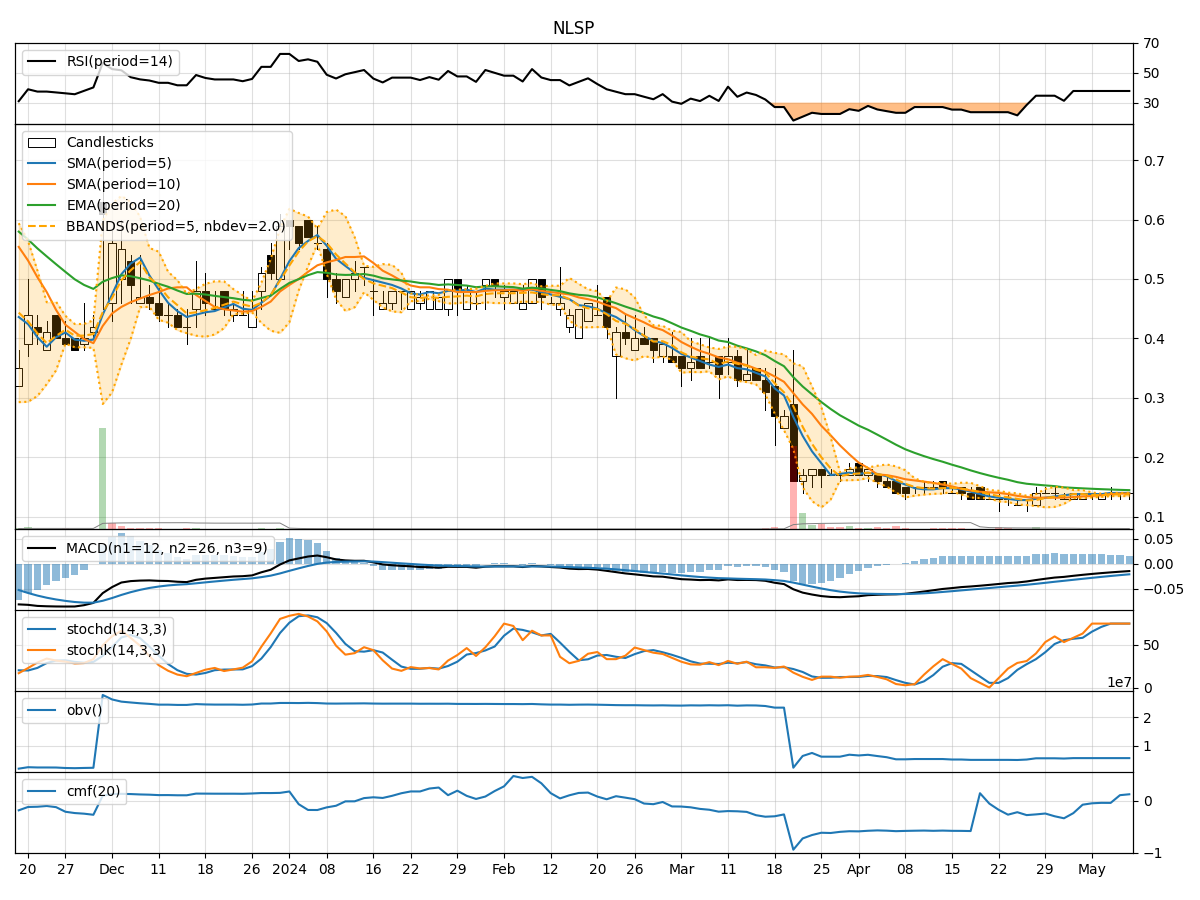
- Moving Averages (MA): The 5-day MA has been relatively stable around $0.14, indicating a consistent price level.
- MACD: The MACD line has been negative, suggesting a bearish trend in the short term.
- EMA: The EMA has been declining, reflecting a downward momentum in the stock price.
Key Observation: The trend indicators point towards a bearish sentiment in the stock price movement.
Momentum Analysis:
- RSI: The RSI has been around 37.27, indicating a neutral to slightly oversold condition.
- Stochastic Oscillator: Both %K and %D have been at 75, suggesting a potential overbought scenario.
- Williams %R: The indicator has been at -25, indicating a potential oversold condition.
Key Observation: The momentum indicators show a mixed signal with a slight inclination towards a bearish sentiment.
Volatility Analysis:
- Bollinger Bands (BB): The bands have remained relatively narrow, indicating low volatility.
- Bollinger %B: The %B has been consistently at 1.000, suggesting the price is at the upper band limit.
Key Observation: Volatility indicators suggest a low volatility environment with the price nearing the upper band limit.
Volume Analysis:
- On-Balance Volume (OBV): The OBV has remained constant, indicating a lack of significant volume accumulation.
- Chaikin Money Flow (CMF): The CMF has shown a slight increase, indicating some buying pressure.
Key Observation: Volume indicators suggest neutral volume accumulation with a slight increase in buying pressure.
Conclusion:
Based on the analysis of the technical indicators, the next few days' possible stock price movement for NLSP stock is likely to be sideways with a bearish bias. The trend indicators signal a bearish sentiment, while momentum indicators show a mixed outlook leaning towards bearish. Volatility remains low, indicating a potential consolidation phase, and volume indicators suggest neutral volume accumulation with some buying pressure.
Key Conclusion: The overall outlook suggests a sideways movement with a bearish bias in the coming days for NLSP stock. Investors should exercise caution and closely monitor the price action for any potential trend reversal signals.