Technical Analysis of NHTC 2024-05-10
Overview:
In analyzing the technical indicators for NHTC over the last 5 days, we will delve into the trend, momentum, volatility, and volume indicators to provide a comprehensive assessment of the stock's potential price movement. By examining these key factors, we aim to offer valuable insights and predictions for the next few days.
Trend Analysis:
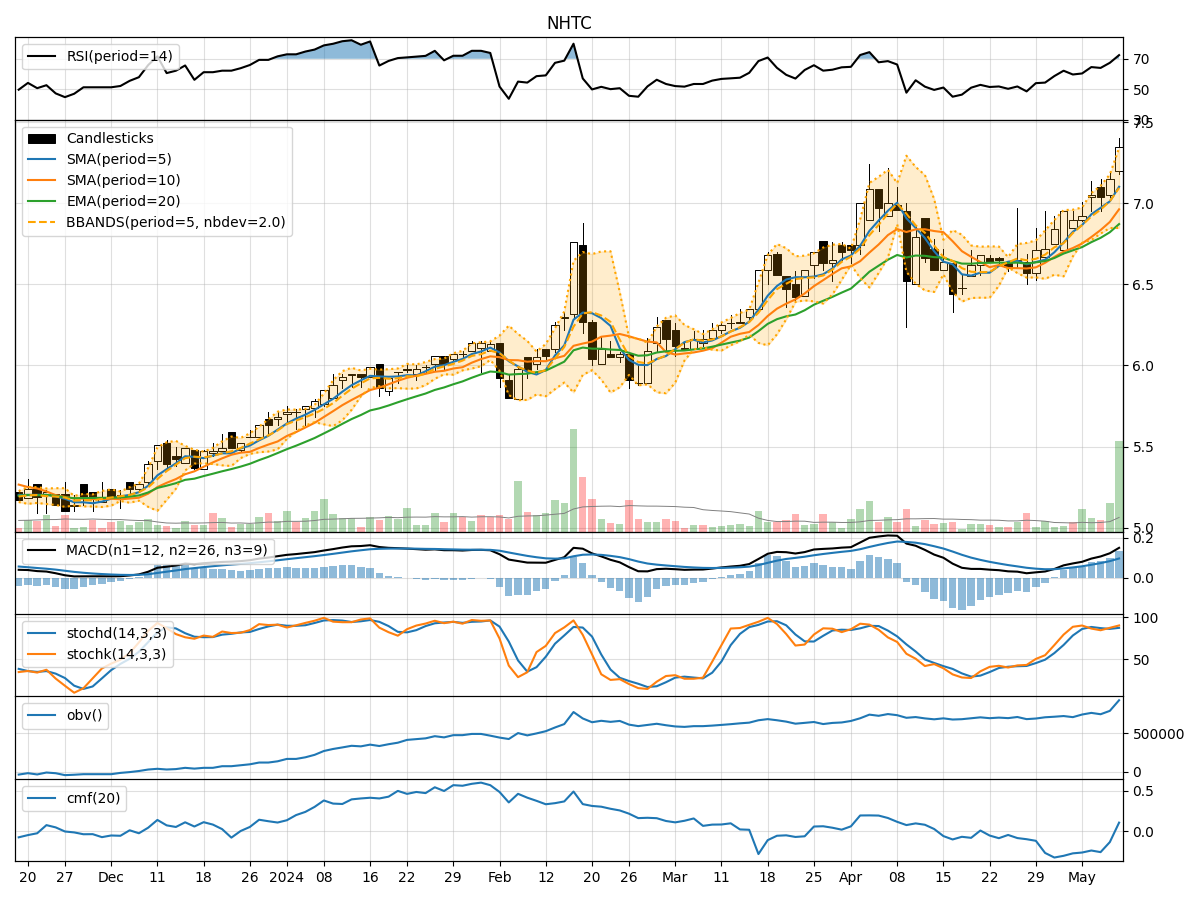
- Moving Averages (MA): The 5-day Moving Average (MA) has been consistently above the Simple Moving Average (SMA) and Exponential Moving Average (EMA), indicating an upward trend in the stock price.
- MACD: The MACD line has been consistently above the signal line, with both lines showing an upward trajectory, suggesting bullish momentum in the stock.
Momentum Analysis:
- RSI: The Relative Strength Index (RSI) has been steadily increasing and is currently in the overbought territory, indicating strong bullish momentum.
- Stochastic Oscillator: Both %K and %D lines of the Stochastic Oscillator are in the overbought zone, suggesting that the stock is overbought and may experience a pullback soon.
Volatility Analysis:
- Bollinger Bands (BB): The stock price has been consistently trading above the middle Bollinger Band (BBM), indicating bullish momentum. The bands are widening, suggesting increasing volatility in the stock price.
- Bollinger %B (BBP): The %B indicator is above 0.8, indicating that the stock is overbought and may be due for a correction.
Volume Analysis:
- On-Balance Volume (OBV): The OBV indicator has been showing positive accumulation, indicating that volume has been higher on days with upward price movement.
- Chaikin Money Flow (CMF): The CMF is negative, suggesting distribution in the stock.
Conclusion:
Based on the technical indicators analyzed: - The stock is currently in an upward trend supported by moving averages and MACD. - Momentum indicators like RSI and Stochastic Oscillator suggest that the stock is overbought and may experience a pullback. - Volatility indicators show that the stock is experiencing increased volatility and is currently overbought according to Bollinger Bands. - Volume indicators indicate positive accumulation but also show signs of distribution according to CMF.
Overall Assessment:
Considering the technical indicators and the current market dynamics, the next few days for NHTC may see a short-term pullback due to overbought conditions indicated by momentum and volatility indicators. However, the overall trend remains bullish in the medium to long term. Traders should exercise caution and consider potential profit-taking opportunities in the near future.