Technical Analysis of NDAQ 2024-05-10
Overview:
In analyzing the technical indicators for NDAQ over the last 5 days, we will delve into the trend, momentum, volatility, and volume indicators to provide a comprehensive outlook on the possible stock price movement. By examining these key aspects, we aim to offer valuable insights and predictions for the upcoming days.
Trend Analysis:
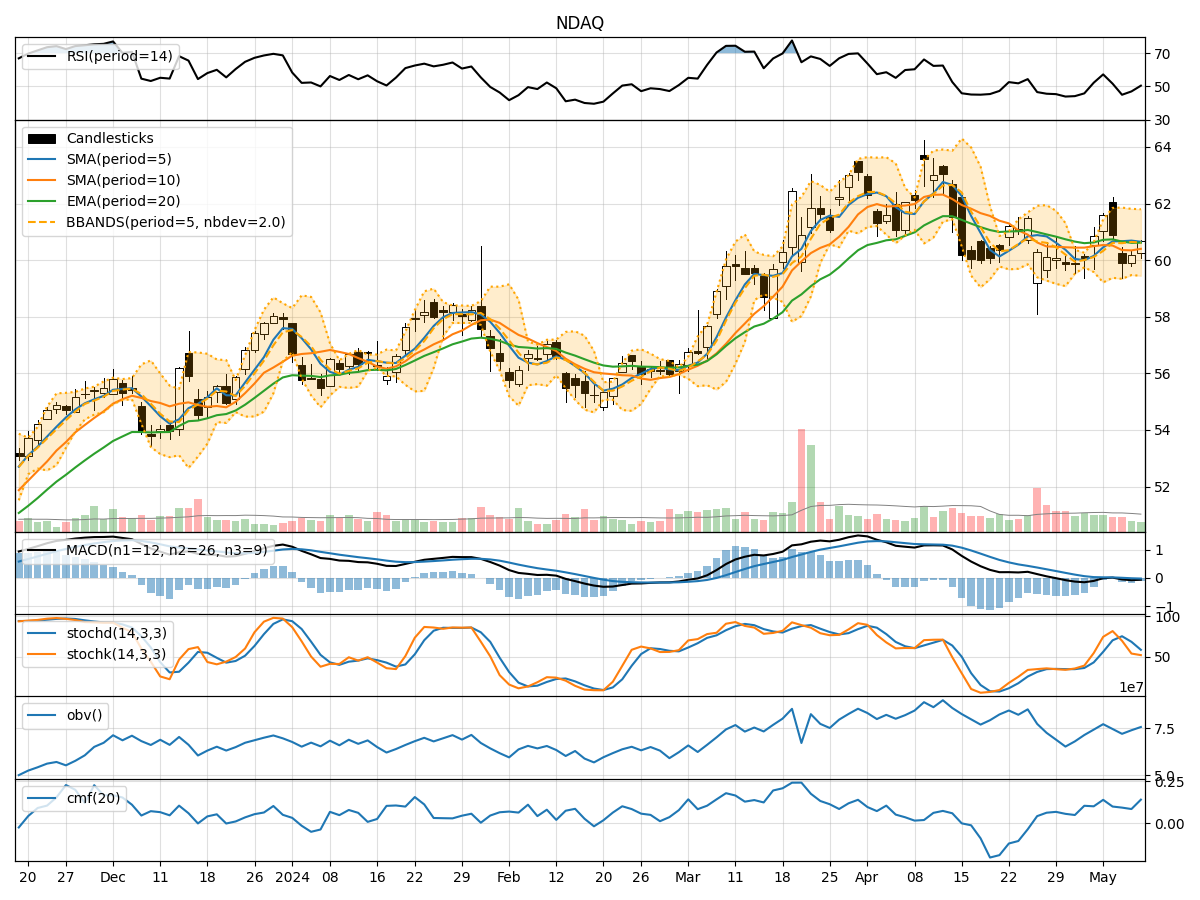
- Moving Averages (MA): The 5-day MA has been fluctuating around the closing prices, indicating short-term price trends. The SMA(10) and EMA(20) have shown a slight decline, suggesting a weakening trend.
- MACD: The MACD line has been negative, with the MACD histogram also in the negative territory. This indicates a bearish momentum in the stock price.
- Conclusion: The trend indicators suggest a bearish outlook for NDAQ in the short term.
Momentum Analysis:
- RSI: The RSI has been declining, indicating a loss of bullish momentum and potential oversold conditions.
- Stochastic Oscillator: Both %K and %D have been decreasing, signaling a potential reversal in price direction.
- Williams %R: The indicator has been moving towards oversold levels, suggesting a possible bounce back.
- Conclusion: The momentum indicators point towards a bearish sentiment in the near future.
Volatility Analysis:
- Bollinger Bands: The bands have been narrowing, indicating decreasing volatility and a potential breakout in price.
- Conclusion: The volatility indicators suggest a consolidation phase in the stock price.
Volume Analysis:
- On-Balance Volume (OBV): The OBV has shown mixed movements, indicating indecision among market participants.
- Chaikin Money Flow (CMF): The CMF has been relatively stable, suggesting a neutral sentiment towards the stock.
- Conclusion: The volume indicators reflect a sideways movement in the stock price.
Overall Conclusion:
Based on the analysis of trend, momentum, volatility, and volume indicators, the next few days' possible stock price movement for NDAQ is likely to be bearish in the short term. The trend indicators signal a weakening trend, while momentum indicators support a bearish sentiment. Volatility indicators point towards a consolidation phase, and volume indicators suggest a sideways movement.
Recommendation:
Considering the overall analysis, it is advisable to exercise caution when trading NDAQ in the upcoming days. Traders may consider short-term bearish strategies or wait for more clarity in the market direction before taking significant positions. Monitoring key support and resistance levels along with any potential breakout points will be crucial for making informed trading decisions.
Disclaimer:
This analysis is based solely on technical indicators and historical data, and it is essential to consider other fundamental factors and market dynamics before making any investment decisions. Market conditions can change rapidly, so staying updated with real-time data and market news is crucial for successful trading strategies.