Technical Analysis of NCNA 2024-05-10
Overview:
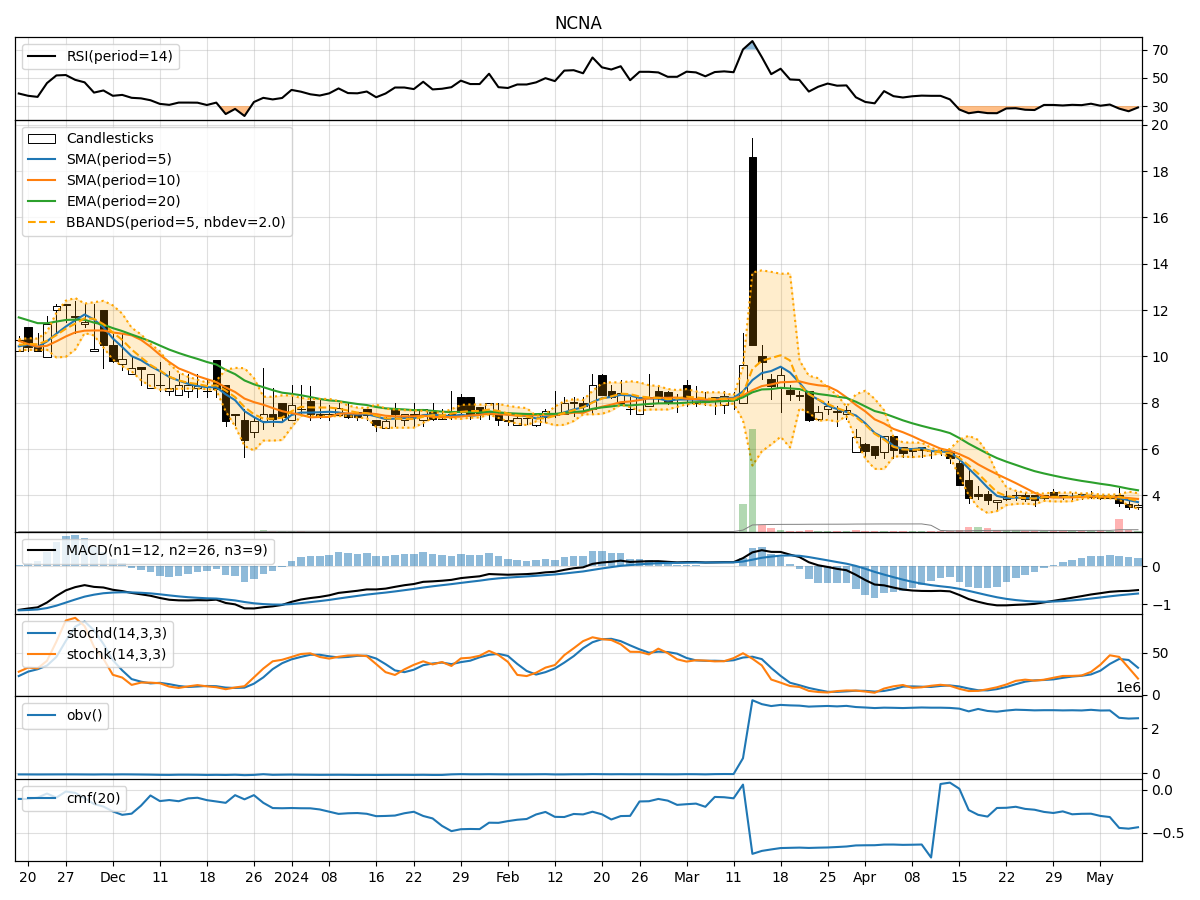
In analyzing the technical indicators for NCNA over the last 5 days, we will delve into the trend, momentum, volatility, and volume indicators to provide a comprehensive outlook on the possible stock price movement in the coming days.
Trend Analysis:
- Moving Averages (MA): The 5-day MA has been consistently below the closing price, indicating a short-term downtrend.
- MACD: The MACD line has been below the signal line, suggesting a bearish momentum.
- EMA: The exponential moving average has been declining, reflecting a weakening trend.
Key Observation: The trend indicators point towards a bearish sentiment in the short term.
Momentum Analysis:
- RSI: The Relative Strength Index has been hovering around oversold levels, indicating a potential reversal.
- Stochastic Oscillator: Both %K and %D have been trending downwards, signaling a bearish momentum.
- Williams %R: The indicator has been in oversold territory, suggesting a possible bounce back.
Key Observation: Momentum indicators are mixed, with a slight bearish bias.
Volatility Analysis:
- Bollinger Bands: The stock price has been trading below the lower Bollinger Band, indicating oversold conditions.
- Bollinger %B: The %B indicator has been below 0.2, signaling potential undervaluation.
- Bollinger Band Width: The band width has widened, suggesting increased volatility.
Key Observation: Volatility indicators point towards oversold conditions and potential for a rebound.
Volume Analysis:
- On-Balance Volume (OBV): The OBV has been declining, indicating selling pressure.
- Chaikin Money Flow (CMF): The CMF has been negative, reflecting outflow of money from the stock.
Key Observation: Volume indicators suggest bearish sentiment with selling pressure.
Conclusion:
Based on the analysis of the technical indicators, the next few days for NCNA are likely to see a potential reversal in the stock price. While the trend and volume indicators indicate a bearish sentiment, the momentum and volatility indicators suggest a possible bounce back from oversold conditions. Traders should closely monitor the price action for signs of a reversal or bullish momentum confirmation before considering any long positions.
Key Takeaways:
- The stock is currently in a short-term downtrend.
- Momentum indicators show a mixed outlook with a slight bearish bias.
- Volatility signals oversold conditions and potential for a rebound.
- Volume indicators reflect selling pressure.
Recommendation:
Considering the mixed signals from the technical indicators, it is advisable for traders to exercise caution and wait for confirmation of a bullish reversal before considering any long positions. Keep a close eye on key support and resistance levels for potential entry or exit points.