Technical Analysis of NAAS 2024-05-10
Overview:
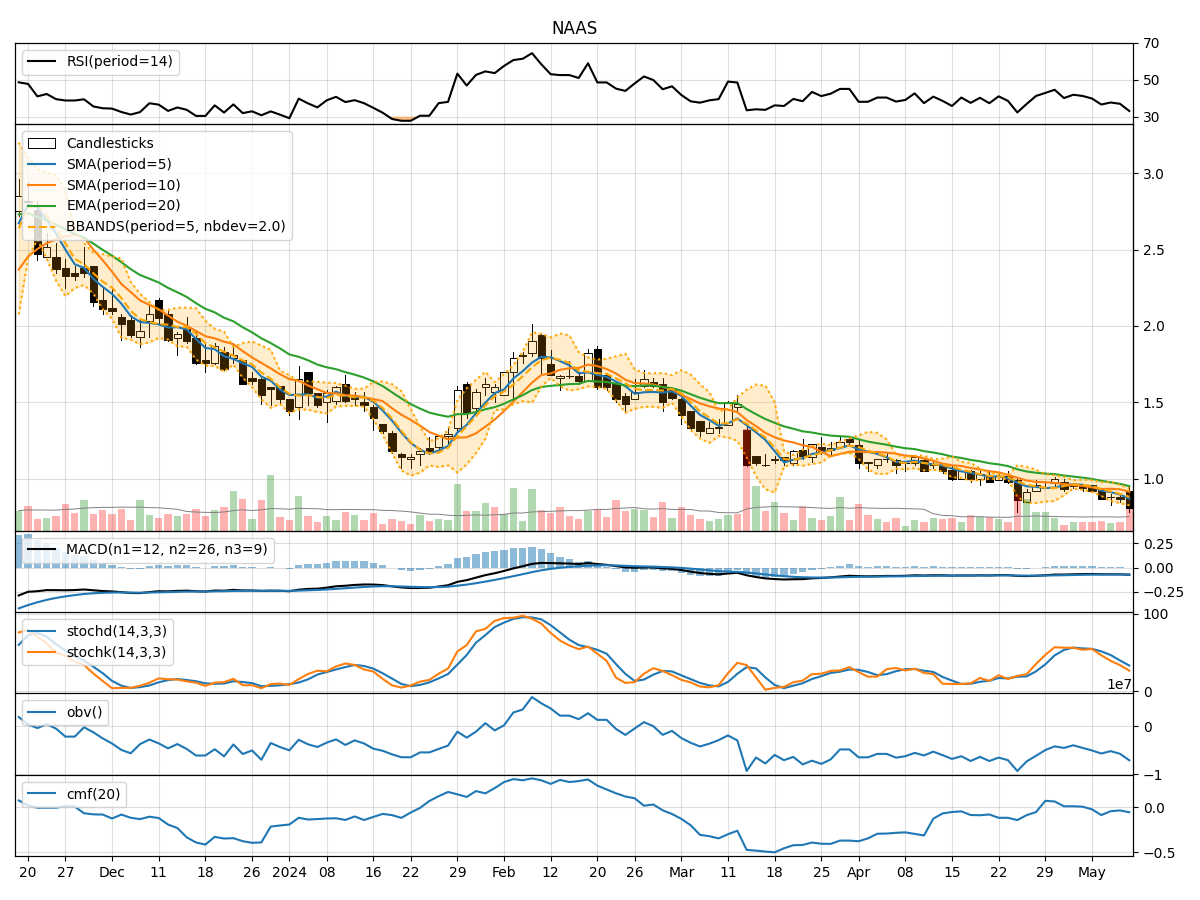
In analyzing the technical indicators for NAAS stock over the last 5 days, we will delve into the trends, momentum, volatility, and volume aspects to provide a comprehensive outlook on the possible stock price movement in the upcoming days.
Trend Analysis:
- Moving Averages (MA): The 5-day Moving Average (MA) has been consistently decreasing, indicating a downward trend in the stock price.
- MACD: The Moving Average Convergence Divergence (MACD) is negative and decreasing, suggesting a bearish momentum in the stock.
- EMA: The Exponential Moving Average (EMA) is also on a downward trajectory, reinforcing the bearish sentiment in the stock.
Momentum Analysis:
- RSI: The Relative Strength Index (RSI) is below 50, indicating a bearish momentum in the stock.
- Stochastic Oscillator: Both %K and %D are decreasing, signaling a bearish momentum.
- Williams %R: The Williams %R is in the oversold territory, suggesting a potential reversal or continuation of the downtrend.
Volatility Analysis:
- Bollinger Bands (BB): The Bollinger Bands are narrowing, indicating decreasing volatility in the stock.
- BB %B: The %B is below 0.2, suggesting the stock is oversold.
- BB Width: The narrowing of the Bollinger Bands width indicates a potential decrease in volatility.
Volume Analysis:
- On-Balance Volume (OBV): The OBV is consistently decreasing, indicating selling pressure in the stock.
- Chaikin Money Flow (CMF): The CMF is negative, suggesting outflow of money from the stock.
Key Observations:
- The stock is in a clear downtrend based on moving averages and MACD.
- Momentum indicators like RSI and Stochastic Oscillator support the bearish sentiment.
- Volatility is decreasing, indicating a potential consolidation phase.
- Volume indicators show selling pressure with decreasing OBV and negative CMF.
Conclusion:
Based on the analysis of technical indicators, the next few days are likely to see a continuation of the bearish trend in NAAS stock. Traders and investors should exercise caution as the stock shows signs of weakness and selling pressure. Consider waiting for a reversal confirmation or a significant change in the technical indicators before considering any long positions.