Technical Analysis of NA 2024-05-10
Overview:
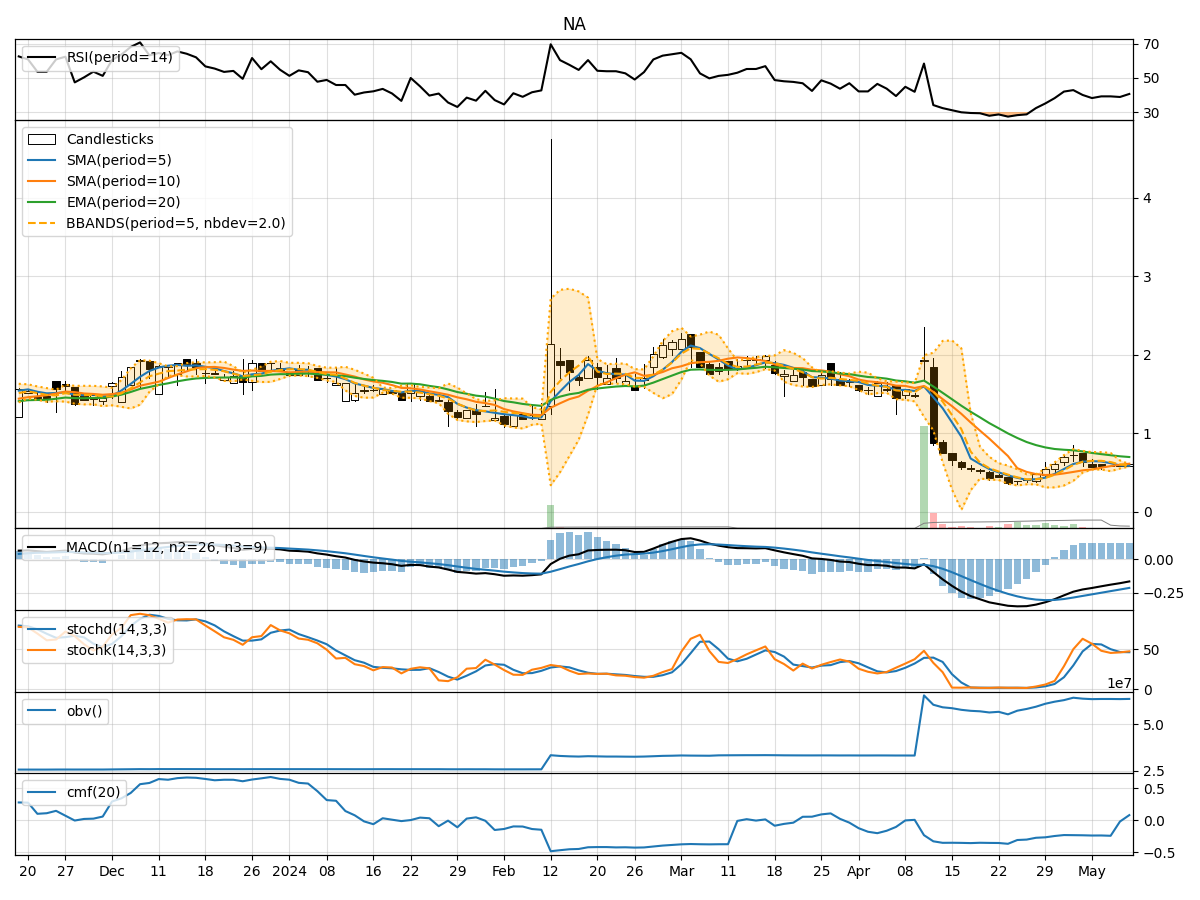
In analyzing the technical indicators for NA stock over the last 5 days, we will delve into the trends, momentum, volatility, and volume aspects to provide a comprehensive outlook on the possible stock price movement in the coming days. By examining key indicators such as moving averages, MACD, RSI, Stochastic Oscillator, Bollinger Bands, and OBV, we aim to offer valuable insights and predictions for potential price movements.
Trend Analysis:
- Moving Averages (MA): The 5-day MA has been consistently below the closing prices, indicating a downward trend.
- MACD: The MACD line has been negative, suggesting bearish momentum in the short term.
- EMA: The EMA has been declining, reflecting a weakening trend.
- Overall Trend: The stock has been on a downward trend based on the moving averages and MACD indicators.
Momentum Analysis:
- RSI: The RSI has been below 50, indicating bearish momentum.
- Stochastic Oscillator: Both %K and %D have been below 50, signaling a bearish sentiment.
- Williams %R: The indicator has been in the oversold territory, suggesting a potential reversal.
- Overall Momentum: Momentum indicators point towards a bearish sentiment in the short term.
Volatility Analysis:
- Bollinger Bands: The stock price has been trading below the lower Bollinger Band, indicating oversold conditions.
- Bollinger Band Width: The band width has widened, suggesting increased volatility.
- Bollinger Band %B: The %B is below 0.2, indicating potential oversold conditions.
- Overall Volatility: The stock is experiencing high volatility with oversold conditions.
Volume Analysis:
- On-Balance Volume (OBV): The OBV has been fluctuating, indicating indecision among investors.
- Chaikin Money Flow (CMF): The CMF has been negative, suggesting outflow of money from the stock.
- Overall Volume: Volume indicators reflect mixed signals with no clear direction.
Conclusion:
Based on the analysis of trend, momentum, volatility, and volume indicators, the stock is currently in a bearish phase with downward trends and negative momentum. The high volatility and oversold conditions suggest a potential reversal or consolidation in the near future. Investors should exercise caution and closely monitor key support levels for any signs of a trend reversal. The next few days are likely to see continued downward pressure on the stock price unless there is a significant shift in market sentiment or positive news catalysts. It is advisable to wait for more clarity in the market before considering any long positions.