Technical Analysis of MYNA 2024-05-10
Overview:
In analyzing the technical indicators for MYNA stock over the last 5 days, we will delve into the trend, momentum, volatility, and volume indicators to provide a comprehensive outlook on the possible future stock price movement. By examining these key indicators, we aim to offer valuable insights and predictions for the upcoming trading days.
Trend Analysis:
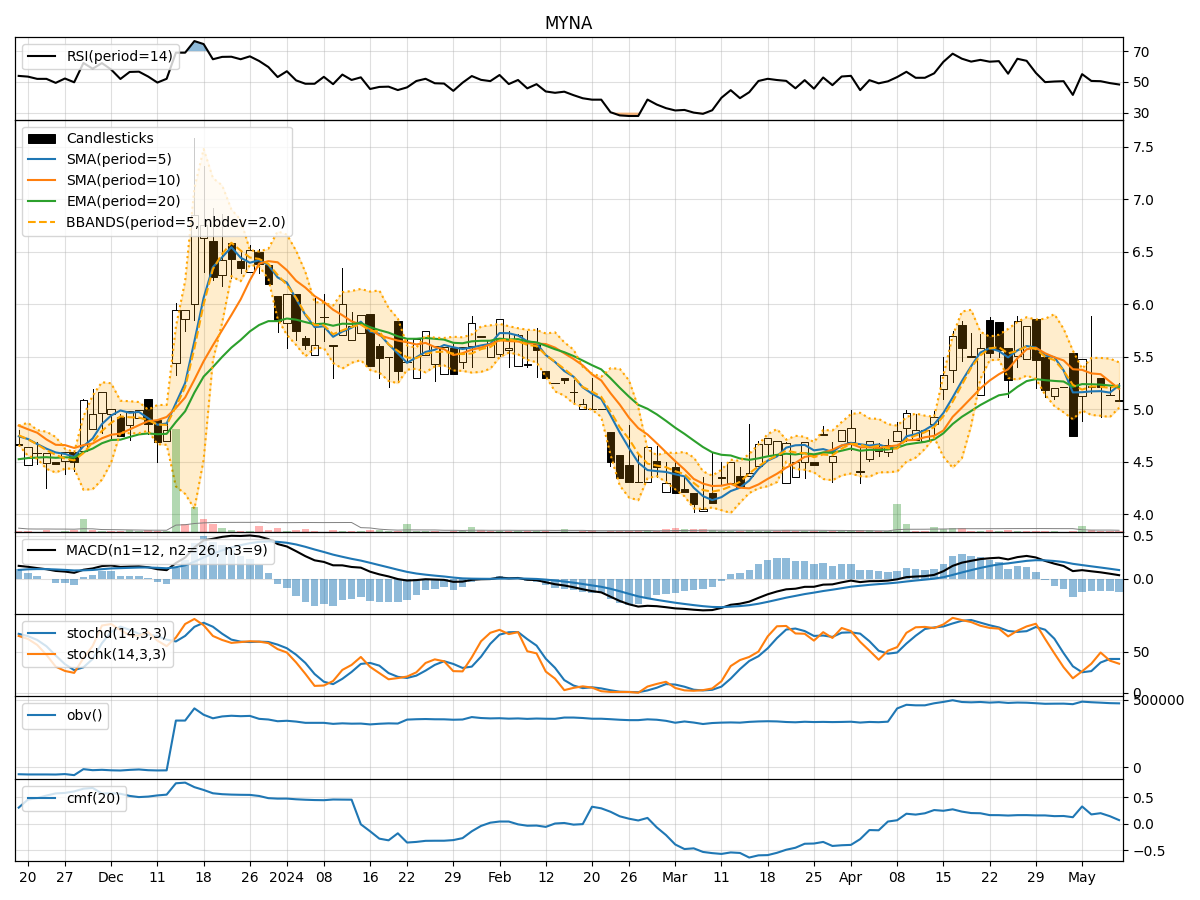
- Moving Averages (MA): The 5-day Moving Average (MA) has been fluctuating around the closing prices, indicating a lack of clear trend direction.
- MACD: The Moving Average Convergence Divergence (MACD) has shown positive values, suggesting a potential bullish momentum.
- EMA: The Exponential Moving Average (EMA) has been relatively stable, reflecting a moderate trend.
Momentum Analysis:
- RSI: The Relative Strength Index (RSI) has been hovering around the mid-range, indicating a neutral momentum.
- Stochastic Oscillator: Both %K and %D values have been fluctuating, showing indecision in momentum.
- Williams %R: The Williams %R has been in oversold territory, signaling a potential reversal.
Volatility Analysis:
- Bollinger Bands (BB): The Bollinger Bands have been narrowing, suggesting decreasing volatility.
- BB% (Bollinger Band %B): The %B indicator has been declining, indicating a potential consolidation phase.
Volume Analysis:
- On-Balance Volume (OBV): The OBV has been decreasing, signaling a potential distribution phase.
- Chaikin Money Flow (CMF): The CMF has been declining, indicating a decrease in buying pressure.
Key Observations:
- The trend indicators show a mixed signal with a slight bullish bias due to the positive MACD values.
- Momentum indicators suggest a neutral stance with a potential for a reversal based on the Williams %R.
- Volatility indicators point towards decreasing volatility and a possible consolidation phase.
- Volume indicators indicate a decrease in buying pressure and potential distribution.
Conclusion:
Based on the analysis of the technical indicators, the stock price of MYNA is likely to experience sideways movement in the next few days. The mixed signals from trend and momentum indicators, coupled with decreasing volatility and volume, suggest a period of consolidation. Traders should exercise caution and wait for clearer signals before making significant trading decisions.