Technical Analysis of MURA 2024-05-10
Overview:
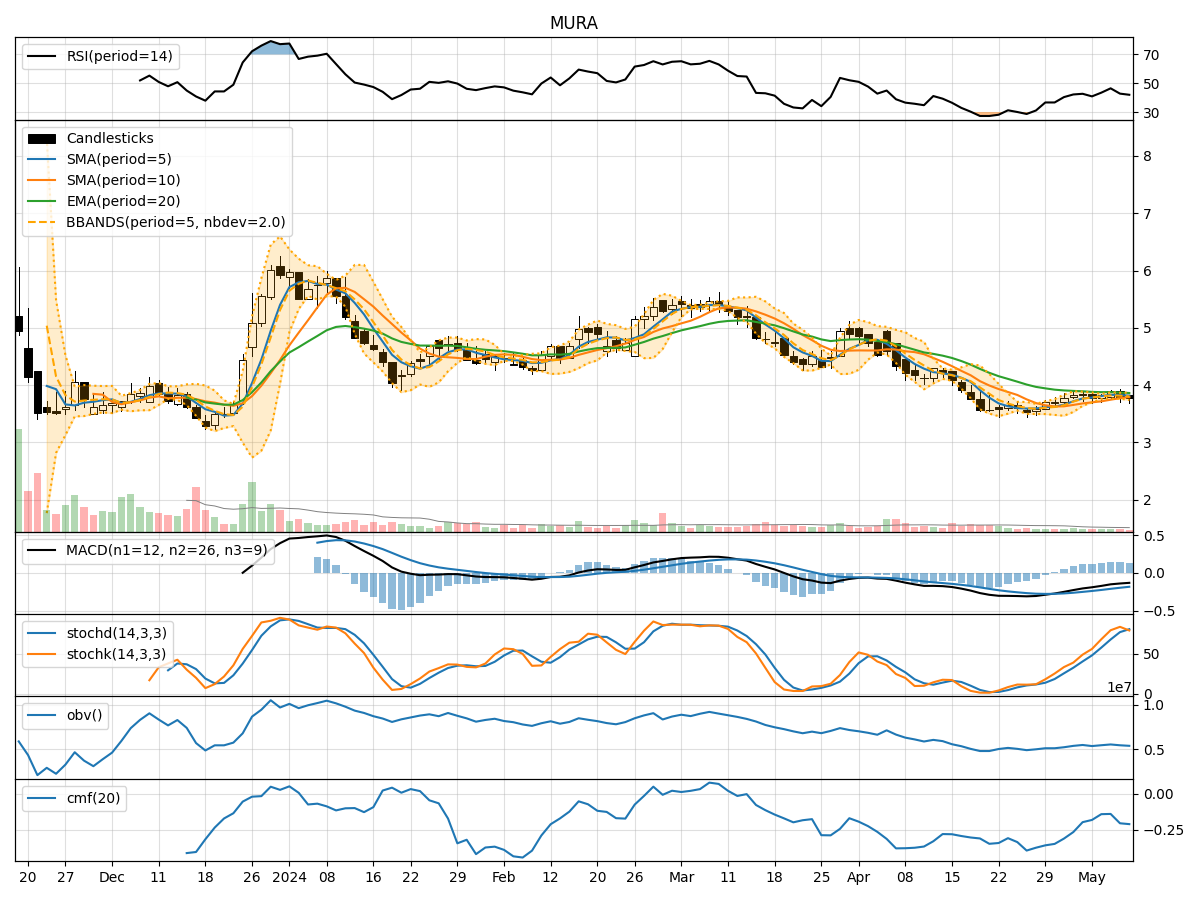
In analyzing the technical indicators for MURA stock over the last 5 days, we will delve into the trend, momentum, volatility, and volume indicators to provide a comprehensive outlook on the possible stock price movement in the coming days.
Trend Analysis:
- Moving Averages (MA): The 5-day Moving Average (MA) has been relatively stable around the current price, indicating a short-term equilibrium.
- MACD: The Moving Average Convergence Divergence (MACD) has been negative but showing signs of convergence towards the signal line, suggesting a potential reversal.
- EMA: The Exponential Moving Average (EMA) has been declining, indicating a bearish trend in the medium term.
Momentum Analysis:
- RSI: The Relative Strength Index (RSI) has been hovering around the mid-level, indicating a balanced momentum.
- Stochastic Oscillator: Both %K and %D have been in the overbought zone, suggesting a potential reversal or consolidation.
- Williams %R: The Williams %R is in the oversold territory, indicating a possible buying opportunity.
Volatility Analysis:
- Bollinger Bands: The Bollinger Bands are narrowing, indicating decreasing volatility and a potential breakout in the near future.
- Bollinger %B: The %B indicator is below 1, suggesting the stock is trading below the lower band, potentially oversold.
Volume Analysis:
- On-Balance Volume (OBV): The OBV has been declining, indicating selling pressure in the stock.
- Chaikin Money Flow (CMF): The CMF has been negative, indicating outflow of money from the stock.
Key Observations:
- The stock is currently in a consolidation phase with mixed signals from different indicators.
- The MACD and Stochastic Oscillator suggest a possible reversal or consolidation.
- The narrowing Bollinger Bands indicate a potential breakout in the stock price.
- The OBV and CMF reflect negative sentiment and selling pressure in the stock.
Conclusion:
Based on the analysis of the technical indicators, the next few days' possible stock price movement for MURA is sideways consolidation with a slight upward bias. Traders should closely monitor the MACD for a potential bullish crossover and the Bollinger Bands for a breakout confirmation. However, caution is advised due to the mixed signals from momentum and volume indicators.