Technical Analysis of MTEK 2024-05-10
Overview:
In analyzing the technical indicators for MTEK over the last 5 days, we will delve into the trend, momentum, volatility, and volume indicators to provide a comprehensive outlook on the possible stock price movement. By examining these key factors, we aim to offer valuable insights and predictions for the upcoming days.
Trend Analysis:
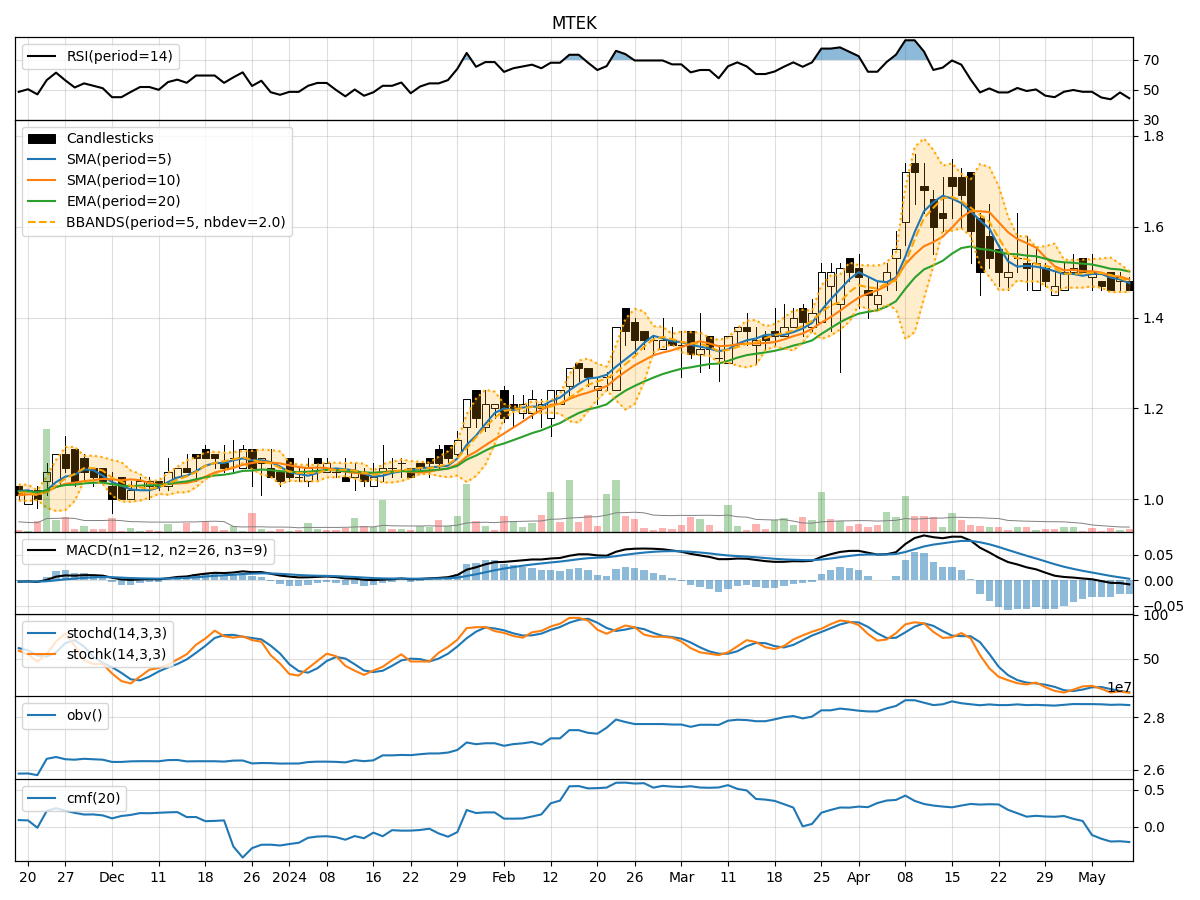
- Moving Averages (MA): The 5-day MA has been gradually decreasing, indicating a short-term bearish trend.
- MACD: The MACD line has been consistently negative, suggesting a bearish momentum in the stock.
- EMA: The EMA has been declining, further supporting the bearish trend in the stock.
Key Observation: The trend indicators point towards a downward trend in the stock price.
Momentum Analysis:
- RSI: The RSI has been fluctuating around the mid-level, indicating a lack of strong momentum in either direction.
- Stochastic Oscillator: Both %K and %D have been decreasing, signaling a weakening momentum.
- Williams %R: The indicator has been in oversold territory, suggesting a potential reversal.
Key Observation: Momentum indicators reflect a neutral to slightly bearish sentiment in the stock.
Volatility Analysis:
- Bollinger Bands: The bands have been narrowing, indicating decreasing volatility in the stock.
- Bollinger %B: The %B has been hovering around the middle, suggesting a lack of extreme price movements.
Key Observation: Volatility indicators point towards a period of consolidation or stability in the stock price.
Volume Analysis:
- On-Balance Volume (OBV): The OBV has been declining, indicating selling pressure in the stock.
- Chaikin Money Flow (CMF): The CMF has been negative, reflecting a lack of buying interest.
Key Observation: Volume indicators suggest a bearish sentiment with more selling pressure in the stock.
Conclusion:
Based on the analysis of trend, momentum, volatility, and volume indicators, the overall outlook for MTEK in the next few days is bearish. The trend indicators show a downward trajectory, momentum indicators indicate a lack of strong buying interest, volatility indicators suggest a period of stability, and volume indicators point towards selling pressure.
Therefore, the next few days are likely to see a continued downward movement in MTEK's stock price. Investors should exercise caution and consider potential shorting opportunities or wait for a more favorable entry point.