Technical Analysis of MTC 2024-05-10
Overview:
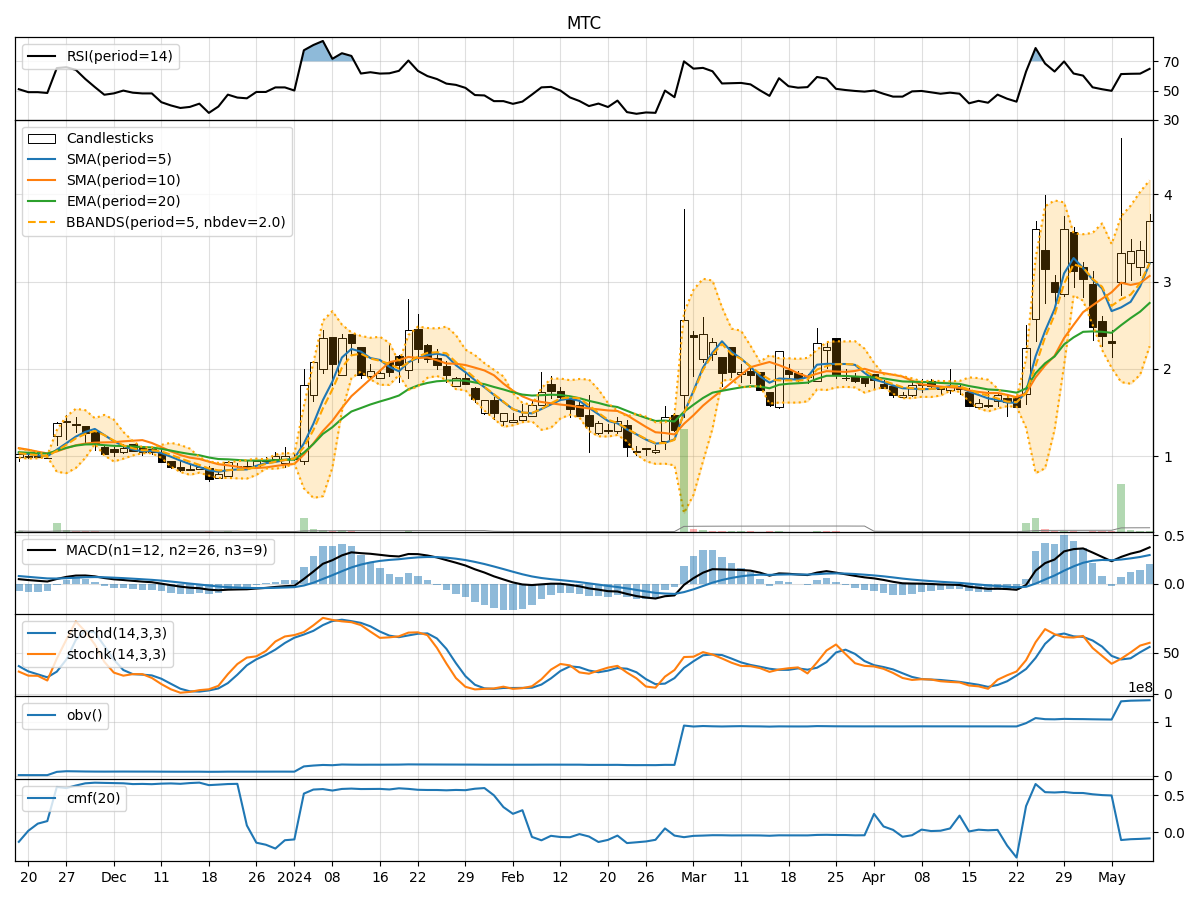
In the last 5 days, MTC stock has shown a consistent upward trend in its price, supported by increasing volume and positive momentum indicators. The volatility has also been expanding, indicating potential price movements. However, it is essential to analyze each technical indicator category to provide a comprehensive outlook on the possible future stock price movement.
Trend Indicators:
- Moving Averages (MA): The 5-day Moving Average (MA) has been trending above the Simple Moving Average (SMA) and Exponential Moving Average (EMA), indicating a bullish trend.
- MACD: The MACD line has been consistently above the signal line, with both lines showing an upward trajectory, suggesting a continuation of the bullish momentum.
- MACD Histogram: The MACD Histogram has been increasing, indicating strengthening bullish momentum.
Momentum Indicators:
- RSI: The Relative Strength Index (RSI) has been in the neutral zone but trending upwards, suggesting a potential continuation of the current uptrend.
- Stochastic Oscillator: Both %K and %D lines of the Stochastic Oscillator have been rising, indicating increasing buying pressure.
- Williams %R: The Williams %R is in the oversold region, suggesting a potential buying opportunity.
Volatility Indicators:
- Bollinger Bands (BB): The Bollinger Bands have been widening, indicating increased price volatility and potential for larger price swings.
- Bollinger %B: The %B indicator has been fluctuating within the bands, suggesting potential price reversals or breakouts.
Volume Indicators:
- On-Balance Volume (OBV): The OBV has been steadily increasing, indicating strong buying pressure and accumulation of the stock.
- Chaikin Money Flow (CMF): The CMF has been negative but improving, suggesting a potential shift towards buying pressure.
Conclusion:
Based on the analysis of the technical indicators, the next few days for MTC stock are likely to see continued upward movement. The bullish trend supported by moving averages, MACD, and positive momentum indicators indicates a favorable outlook for the stock price. The expanding volatility suggests potential for larger price movements, while the increasing volume and improving CMF further support the bullish view.
Key Points:
- Trend: Upward
- Momentum: Positive
- Volatility: Increasing
- Volume: Accumulation
Recommendation:
Considering the overall bullish sentiment in the technical indicators, it is advisable to consider buying MTC stock for potential short to medium-term gains. However, it is crucial to monitor the indicators regularly for any signs of trend reversal or weakening momentum.