Technical Analysis of MSSA 2024-05-31
Overview:
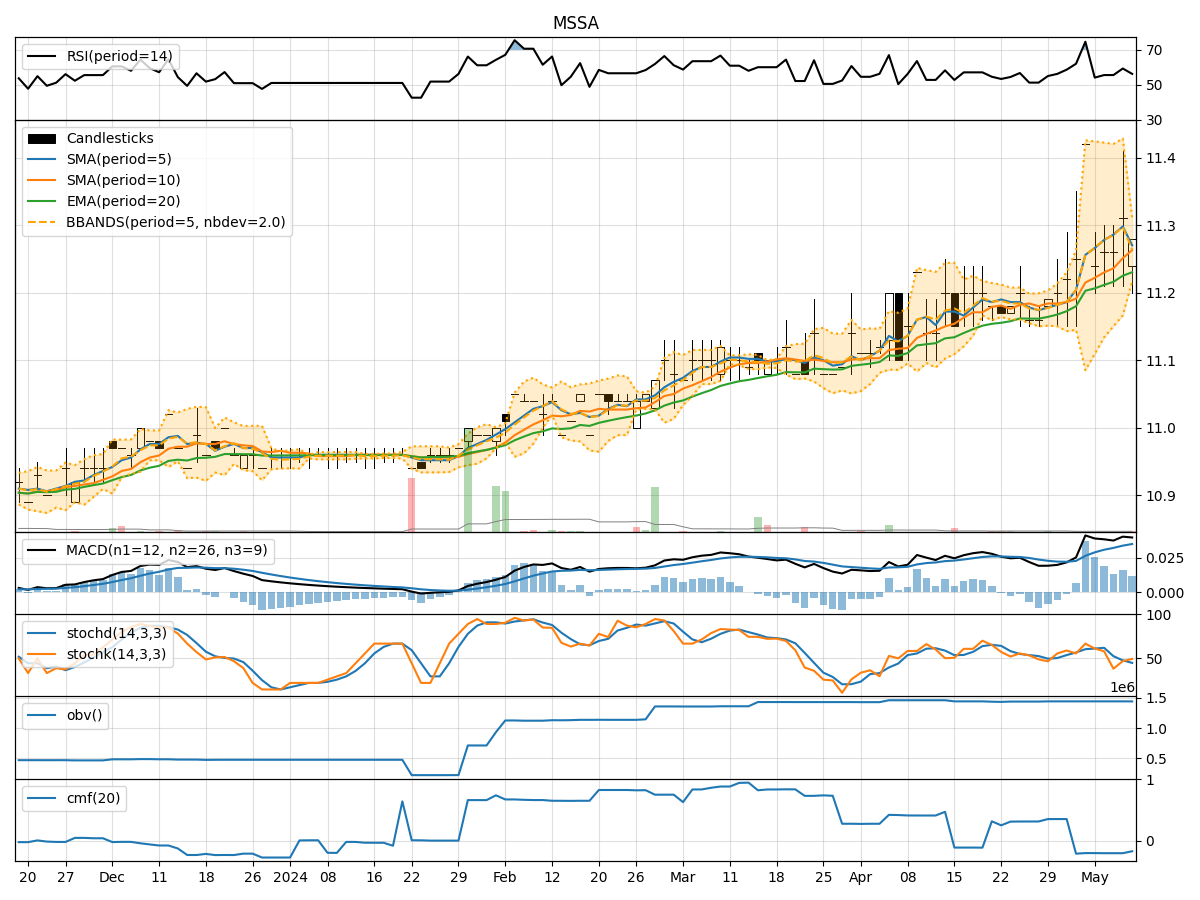
In the last 5 trading days, the stock has shown relatively stable price movements with minor fluctuations. The trend indicators suggest a slightly bullish sentiment, supported by the moving averages and MACD values. Momentum indicators indicate a neutral to slightly bullish momentum, with RSI hovering around the midpoint. Volatility indicators show a narrowing of the Bollinger Bands, indicating decreasing volatility. Volume indicators suggest consistent buying pressure with a positive Chaikin Money Flow.
Trend Indicators:
- Moving Averages (MA): The 5-day MA is slightly above the 10-day SMA, indicating a short-term bullish trend.
- MACD: The MACD line is above the signal line, suggesting a bullish momentum.
Key Observation: The trend indicators point towards a slightly bullish outlook for the stock.
Momentum Indicators:
- RSI: The RSI is around 50, indicating a neutral momentum.
- Stochastic Oscillator: Both %K and %D are in the neutral zone, suggesting a lack of strong momentum.
Key Observation: Momentum indicators reflect a neutral to slightly bullish sentiment.
Volatility Indicators:
- Bollinger Bands (BB): The bands are narrowing, indicating decreasing volatility.
Key Observation: Volatility is decreasing, which could lead to a consolidation phase in the stock price.
Volume Indicators:
- On-Balance Volume (OBV): The OBV shows consistent buying pressure.
- Chaikin Money Flow (CMF): The CMF is positive, indicating strong buying interest.
Key Observation: Volume indicators suggest positive accumulation in the stock.
Conclusion:
Based on the analysis of the technical indicators, the stock is likely to experience sideways movement in the next few days. The trend indicators support a slightly bullish outlook, while momentum indicators suggest a neutral to slightly bullish sentiment. Decreasing volatility indicates a potential consolidation phase, and strong buying pressure indicated by volume indicators supports the possibility of the stock maintaining its current levels.
Overall Assessment: The stock is expected to trade within a narrow range in the upcoming days, with a bias towards a slightly bullish stance. Investors may consider monitoring key support and resistance levels for potential entry or exit points.