Technical Analysis of MRUS 2024-05-10
Overview:
In analyzing the technical indicators for MRUS over the last 5 days, we will delve into the trend, momentum, volatility, and volume indicators to provide a comprehensive assessment of the stock's potential price movement. By examining these key factors, we aim to offer valuable insights and predictions for the next few days.
Trend Indicators:
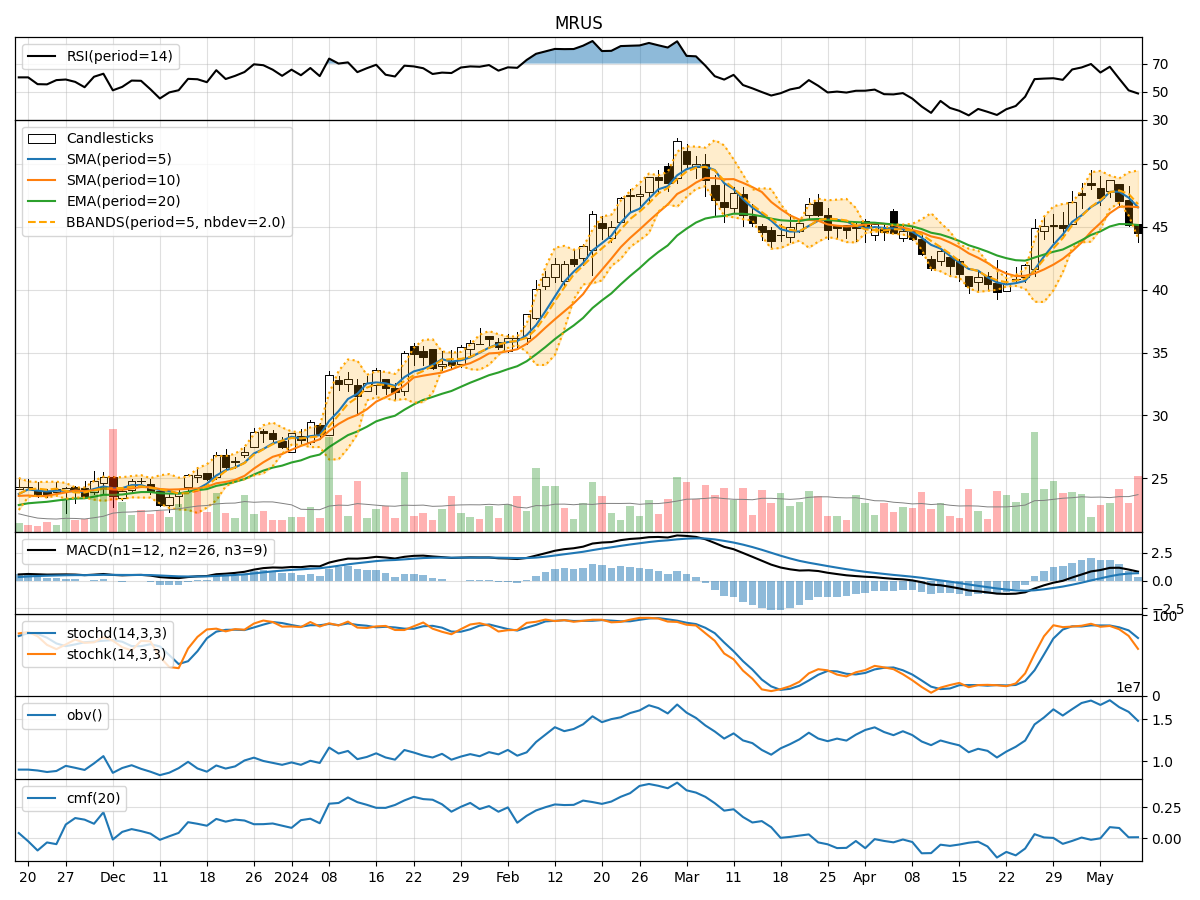
- Moving Averages (MA): The 5-day Moving Average (MA) has been fluctuating around the closing prices, indicating short-term price trends. The Simple Moving Average (SMA) and Exponential Moving Average (EMA) show a gradual increase but with some volatility.
- MACD: The Moving Average Convergence Divergence (MACD) has been positive, suggesting bullish momentum. The MACD Histogram (MACDH) has been increasing, indicating strengthening bullish momentum.
Momentum Indicators:
- RSI: The Relative Strength Index (RSI) has been fluctuating but generally staying above 50, indicating a balanced momentum between buying and selling pressure.
- Stochastic Oscillator: The Stochastic Oscillator shows a decline in the %K and %D values, moving towards oversold territory. This suggests a potential reversal in the short term.
- Williams %R: The Williams %R is in oversold territory, indicating a possible buying opportunity.
Volatility Indicators:
- Bollinger Bands (BB): The Bollinger Bands have been narrowing, suggesting decreasing volatility. The bands are currently close to the price, indicating a potential breakout or significant price movement.
- Bollinger %B: The %B indicator is relatively low, indicating the price is closer to the lower band, potentially signaling an oversold condition.
Volume Indicators:
- On-Balance Volume (OBV): The OBV has been fluctuating, indicating mixed buying and selling pressure. The indicator does not show a clear trend in volume accumulation.
- Chaikin Money Flow (CMF): The CMF has been positive but relatively flat, suggesting a neutral stance on money flow.
Key Observations and Opinions:
- Trend: The trend indicators suggest a mixed outlook, with some bullish signals from the MACD but volatility in moving averages.
- Momentum: Momentum indicators show a potential short-term reversal as the stock enters oversold territory.
- Volatility: Volatility has been decreasing, indicating a potential consolidation phase before a breakout.
- Volume: Volume indicators do not provide a clear direction, reflecting uncertainty in market participation.
Conclusion:
Based on the analysis of the technical indicators, the next few days for MRUS could see sideways consolidation with a potential bullish bias. Traders should watch for a breakout from the Bollinger Bands and monitor the Stochastic Oscillator for a reversal confirmation. The stock may experience a short-term rebound from oversold conditions, but caution is advised due to the mixed signals from volume indicators.