Technical Analysis of MRNA 2024-05-10
Overview:
In analyzing the technical indicators for Moderna Inc. (MRNA) over the last 5 days, we will delve into the trends, momentum, volatility, and volume indicators to provide insights into the possible future stock price movement. By examining these key aspects, we aim to offer a comprehensive analysis and make informed predictions for the upcoming days.
Trend Analysis:
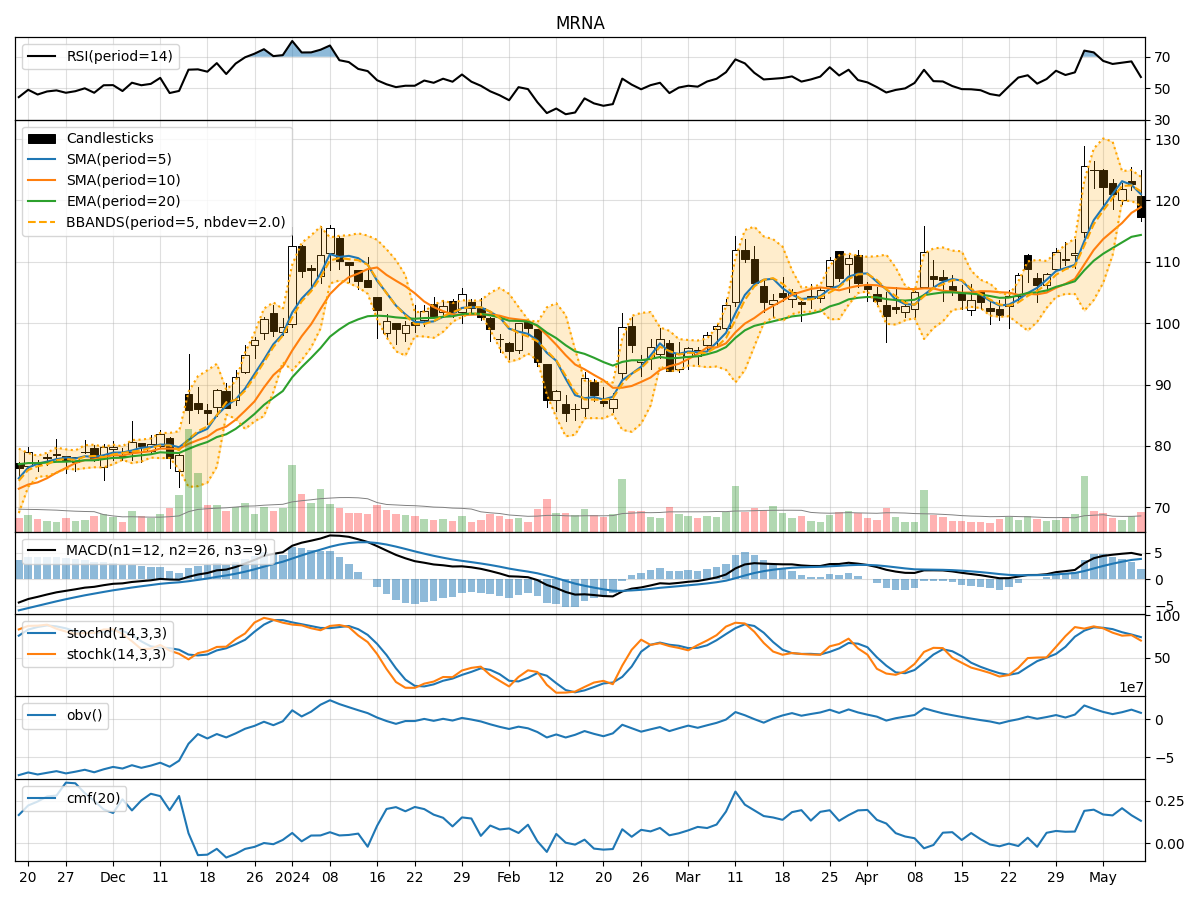
- Moving Averages (MA): The 5-day Moving Average (MA) has been fluctuating around the closing prices, indicating short-term price trends. The Simple Moving Average (SMA) and Exponential Moving Average (EMA) show an overall uptrend.
- MACD: The Moving Average Convergence Divergence (MACD) and its signal line (MACDH) have been positive, suggesting bullish momentum in the stock price.
Momentum Analysis:
- RSI: The Relative Strength Index (RSI) has been in the neutral to slightly overbought territory, indicating a balanced momentum.
- Stochastic Oscillator: Both %K and %D have been declining, suggesting a potential reversal in momentum.
- Williams %R: The Williams %R is in oversold territory, indicating a possible buying opportunity.
Volatility Analysis:
- Bollinger Bands (BB): The Bollinger Bands have been narrowing, indicating decreasing volatility and a potential price breakout.
Volume Analysis:
- On-Balance Volume (OBV): The OBV has been fluctuating, suggesting mixed sentiment among investors.
- Chaikin Money Flow (CMF): The CMF has been positive, indicating buying pressure in the market.
Key Observations:
- The stock has shown a mixed trend with a slight bullish bias in moving averages and MACD.
- Momentum indicators suggest a potential reversal or consolidation in the short term.
- Volatility has been decreasing, indicating a possible period of consolidation.
- Volume indicators show mixed sentiment among investors.
Conclusion:
Based on the analysis of technical indicators, the next few days for MRNA stock could see sideways movement with a slight bullish bias. Traders should watch for potential reversals indicated by momentum indicators and monitor the narrowing Bollinger Bands for a breakout signal. Overall, caution is advised due to the mixed signals from volume indicators.