Technical Analysis of MRM 2024-05-10
Overview:
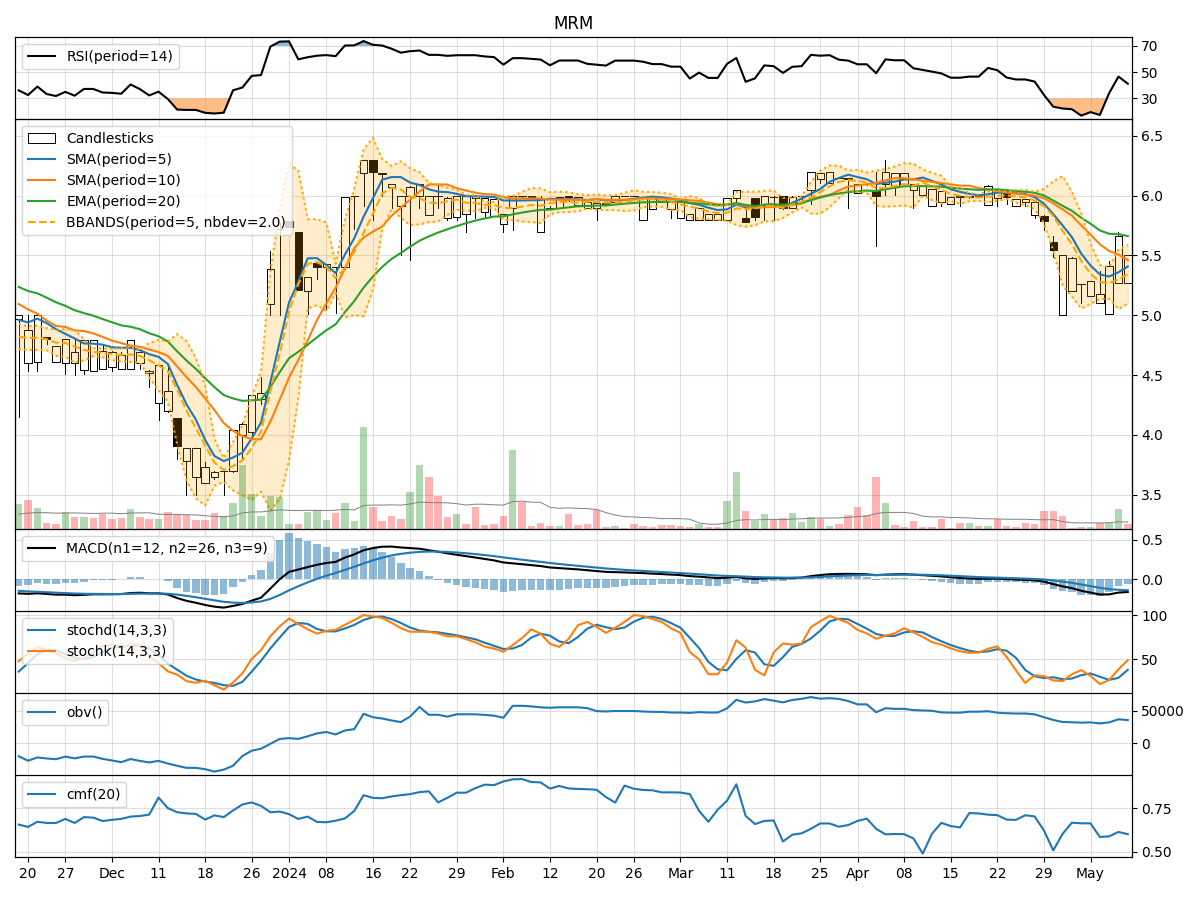
In the last 5 trading days, MRM stock has shown mixed signals across various technical indicators. The stock price has fluctuated within a range, with some indicators suggesting potential weakness while others hint at possible strength. By analyzing trend, momentum, volatility, and volume indicators, we can gain a comprehensive understanding of the stock's potential future movements.
Trend Indicators:
- Moving Averages (MA): The 5-day MA has been below the 10-day SMA, indicating a short-term bearish trend. However, the EMA(20) is slightly above the current price, suggesting a potential reversal.
- MACD: The MACD line has been consistently below the signal line, indicating bearish momentum. The MACD histogram has been decreasing, signaling a weakening bearish trend.
Momentum Indicators:
- RSI: The RSI has been fluctuating in the oversold region, indicating bearish momentum. However, it has shown signs of recovery in the last few days.
- Stochastic Oscillator: Both %K and %D have been moving upwards, suggesting a potential bullish momentum shift. The stock was oversold but is now showing signs of recovery.
Volatility Indicators:
- Bollinger Bands (BB): The stock price has been trading within the bands, indicating a period of consolidation. The bands are not significantly widening or narrowing, suggesting stable volatility.
- Bollinger %B: The %B has been fluctuating around 0.5, indicating the stock is trading at the middle of the bands.
Volume Indicators:
- On-Balance Volume (OBV): The OBV has been slightly decreasing, indicating some distribution happening in the stock. This could be a sign of weakening buying pressure.
- Chaikin Money Flow (CMF): The CMF has been positive, indicating that money is flowing into the stock over the past 20 days.
Conclusion:
Based on the analysis of the technical indicators, the next few days for MRM stock could see sideways movement with a slight bullish bias. The stock is currently in a consolidation phase, as indicated by the Bollinger Bands and %B. The momentum indicators suggest a potential shift towards bullish momentum, supported by the Stochastic Oscillator. However, the trend indicators still show a bearish bias, so any upward movement may face resistance.
Investors should closely monitor the price action around key support and resistance levels to confirm the potential bullish bias. Additionally, keeping an eye on volume trends and any significant news or events that could impact the stock's movement is crucial. Overall, a cautious approach with a focus on risk management would be advisable in the current market environment.