Technical Analysis of MREO 2024-05-10
Overview:
In analyzing the technical indicators for MREO over the last 5 days, we will delve into the trend, momentum, volatility, and volume indicators to provide a comprehensive outlook on the possible stock price movement. By examining these key factors, we aim to offer valuable insights and predictions for the upcoming days.
Trend Analysis:
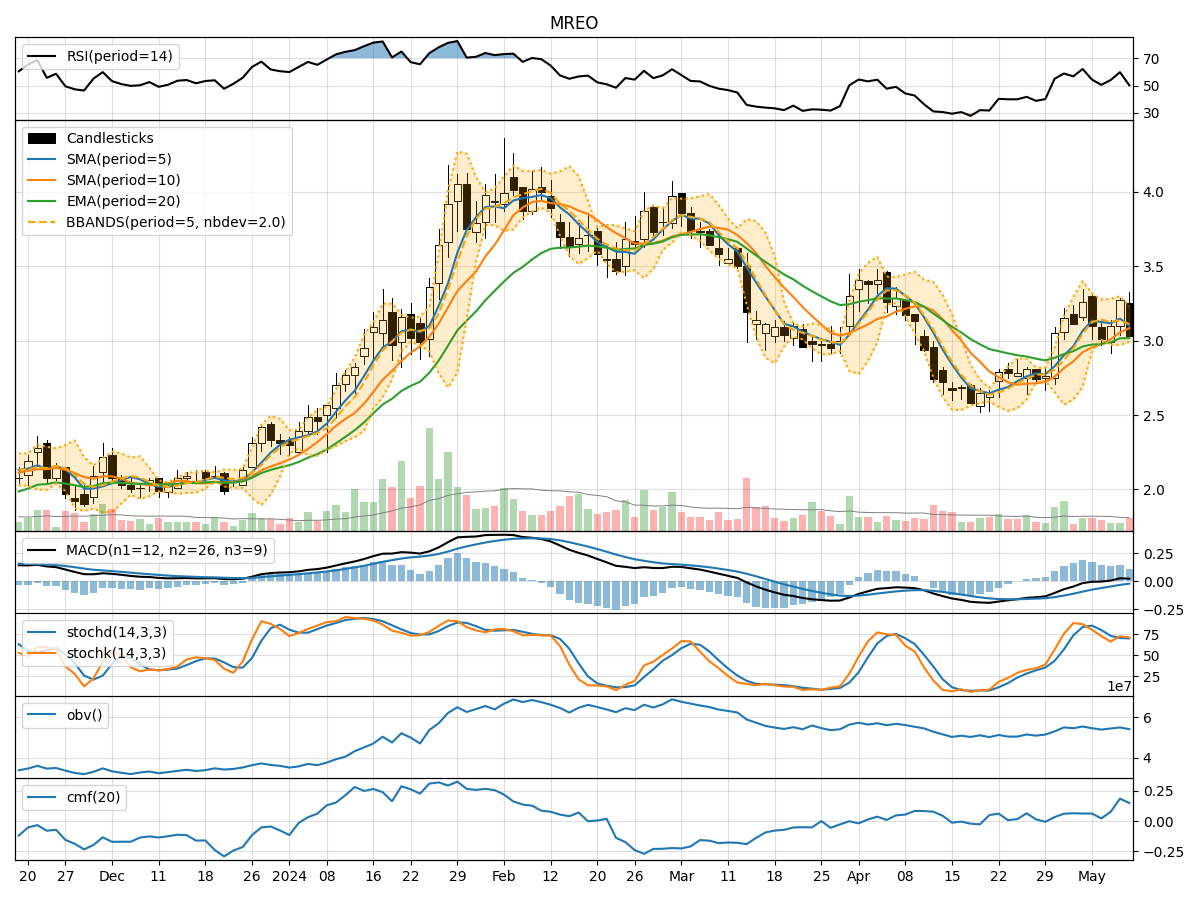
- Moving Averages (MA): The 5-day MA has been fluctuating around the stock price, indicating short-term volatility. The SMA(10) and EMA(20) show a slight upward trend, suggesting potential bullish momentum.
- MACD: The MACD line has been positive, indicating a bullish trend. The MACD Histogram has been increasing, signaling strengthening bullish momentum.
Momentum Analysis:
- RSI: The RSI has been oscillating around the 50 level, indicating a neutral stance in momentum.
- Stochastic Oscillator: Both %K and %D have been in the overbought region, suggesting a potential reversal or consolidation.
- Williams %R: The Williams %R has been fluctuating in the oversold and overbought zones, indicating mixed momentum signals.
Volatility Analysis:
- Bollinger Bands: The stock price has been trading within the bands, suggesting a period of consolidation. The bands are relatively narrow, indicating low volatility.
- Bollinger %B: The %B indicator has been hovering around the middle range, reflecting a neutral volatility outlook.
Volume Analysis:
- On-Balance Volume (OBV): The OBV has shown a slight decrease, indicating some selling pressure in the stock.
- Chaikin Money Flow (CMF): The CMF has been positive, suggesting buying pressure in the stock over the past 20 days.
Key Observations:
- The trend indicators point towards a potential bullish bias, supported by the positive MACD and moving averages.
- Momentum indicators show mixed signals, with RSI neutral, Stochastic overbought, and Williams %R fluctuating.
- Volatility indicators suggest a period of consolidation with low volatility.
- Volume indicators indicate a slight decrease in buying pressure but overall positive money flow.
Conclusion:
Based on the analysis of the technical indicators, the next few days for MREO could see sideways movement with a slight bullish bias. The stock is likely to consolidate within a range, with limited volatility expected. Traders may consider monitoring key support and resistance levels for potential breakout opportunities. It is advisable to exercise caution and wait for clearer signals before making significant trading decisions.