Technical Analysis of MPWR 2024-05-10
Overview:
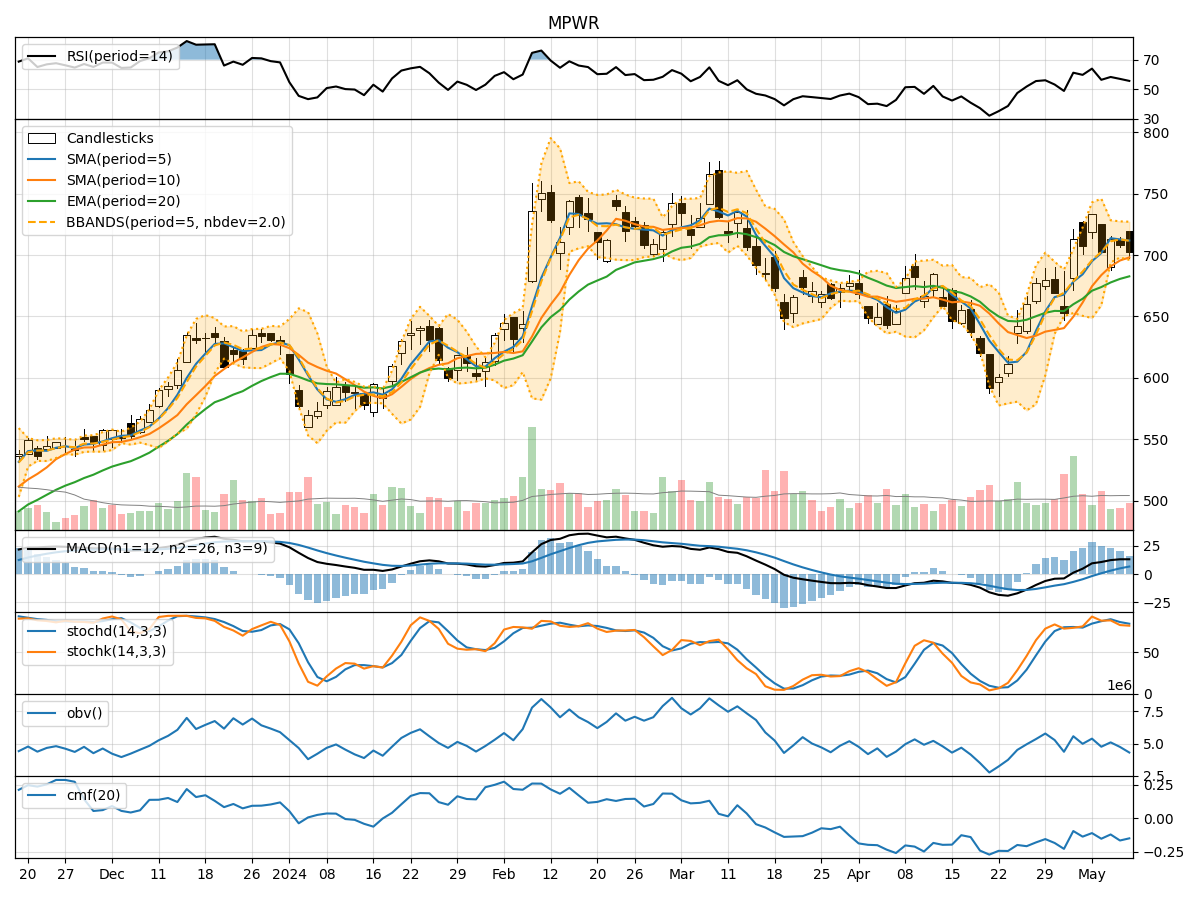
In analyzing the technical indicators for MPWR over the last 5 days, we will delve into the trend, momentum, volatility, and volume indicators to provide a comprehensive outlook on the possible stock price movement. By examining these key aspects, we aim to offer valuable insights and predictions for the upcoming days.
Trend Analysis:
- Moving Averages (MA): The 5-day Moving Average (MA) has been consistently above the Simple Moving Average (SMA) and Exponential Moving Average (EMA), indicating a bullish trend.
- MACD: The MACD line has been above the signal line, with increasing values, suggesting a strengthening bullish momentum.
- Momentum: The Relative Strength Index (RSI) has been fluctuating around the neutral zone, indicating indecision in the market sentiment.
Momentum Analysis:
- RSI: The RSI has been oscillating around the 50 level, reflecting a lack of strong momentum in either direction.
- Stochastic Oscillator: The Stochastic indicators have been in the overbought region, suggesting a potential reversal or consolidation phase.
- Williams %R: The Williams %R has been in the oversold territory, indicating a possible buying opportunity.
Volatility Analysis:
- Bollinger Bands (BB): The Bollinger Bands have been narrowing, indicating decreasing volatility and a potential breakout in the near future.
- Bollinger %B: The %B indicator has been decreasing, signaling a possible consolidation phase.
Volume Analysis:
- On-Balance Volume (OBV): The OBV has been declining, suggesting selling pressure in the market.
- Chaikin Money Flow (CMF): The CMF has been negative, indicating a lack of buying interest.
Key Observations:
- The trend indicators suggest a bullish bias, supported by the MACD and moving averages.
- Momentum indicators show mixed signals, with RSI indicating neutrality and stochastic oscillators hinting at a potential reversal.
- Volatility indicators point towards a potential breakout due to narrowing Bollinger Bands.
- Volume indicators reflect selling pressure and a lack of buying interest in the market.
Conclusion:
Based on the analysis of technical indicators, the stock price of MPWR is likely to experience sideways consolidation in the upcoming days. The bullish trend indicated by moving averages and MACD may face resistance due to mixed momentum signals and decreasing buying interest reflected in volume indicators. Traders should exercise caution and wait for a clear breakout or reversal signal before making significant trading decisions.