Technical Analysis of MOR 2024-05-10
Overview:
In analyzing the technical indicators for MOR stock over the last 5 days, we will delve into the trend, momentum, volatility, and volume indicators to provide a comprehensive outlook on the possible stock price movement in the coming days. By examining these key indicators, we aim to offer valuable insights and predictions for potential investors.
Trend Indicators:
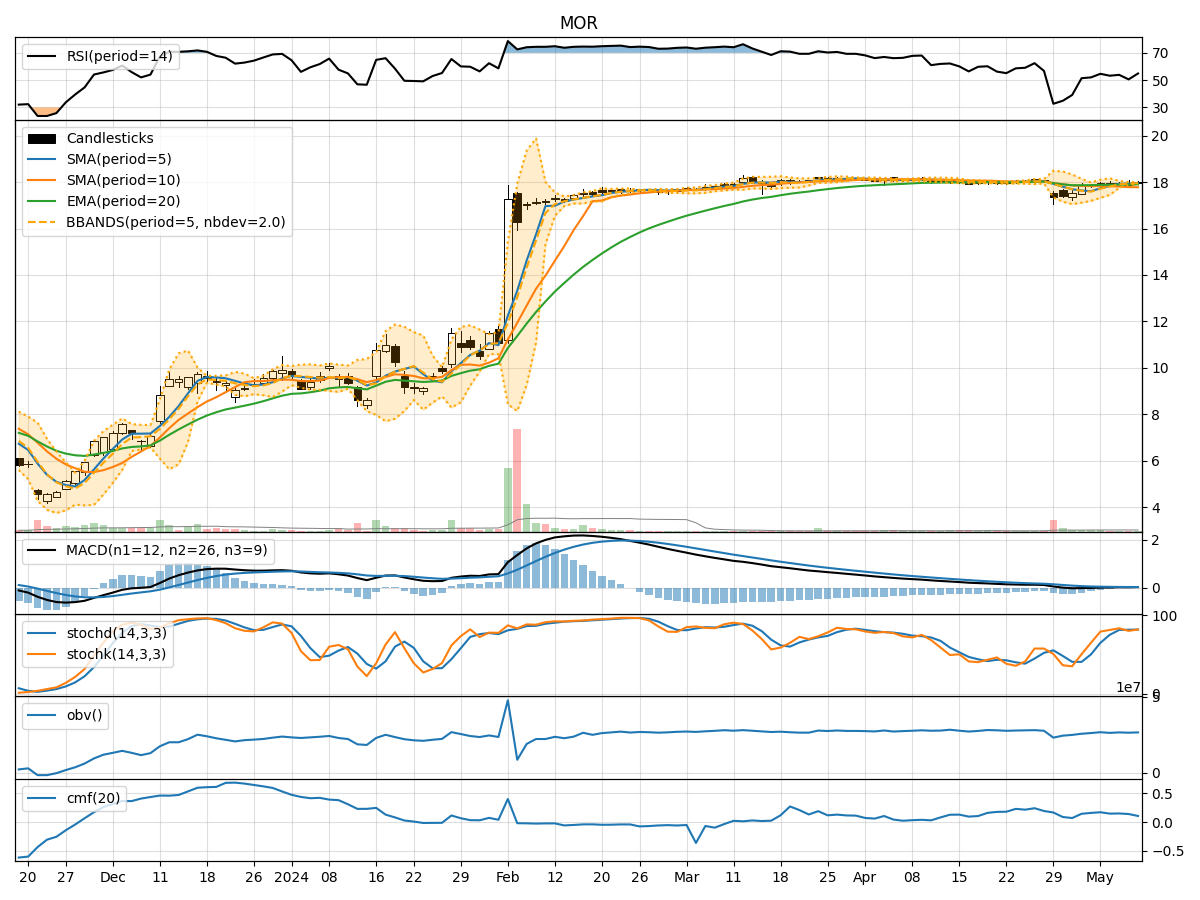
- Moving Averages (MA): The 5-day MA has been showing a slight uptrend, indicating a short-term positive momentum in the stock price.
- MACD: The MACD line has been consistently below the signal line, suggesting a bearish trend in the stock.
- EMA: The EMA has been relatively stable, reflecting a neutral to slightly bearish sentiment in the stock.
Momentum Indicators:
- RSI: The RSI has been fluctuating around the 50 level, indicating a lack of strong momentum in either direction.
- Stochastic Oscillator: Both %K and %D have been hovering around the overbought territory, signaling a potential reversal or consolidation phase.
- Williams %R: The Williams %R has been oscillating near the oversold region, suggesting a possible buying opportunity.
Volatility Indicators:
- Bollinger Bands: The Bollinger Bands have been narrowing, indicating decreasing volatility in the stock price.
- Bollinger %B: The %B indicator has been fluctuating within a tight range, reflecting a period of consolidation.
Volume Indicators:
- On-Balance Volume (OBV): The OBV has been relatively stable, suggesting a balance between buying and selling pressure.
- Chaikin Money Flow (CMF): The CMF has been positive but declining, indicating a potential decrease in buying pressure.
Key Observations:
- The stock is currently in a consolidation phase, as indicated by the narrowing Bollinger Bands and stable OBV.
- Momentum indicators suggest a lack of strong directional bias, with oscillations near overbought and oversold levels.
- The MACD line below the signal line points to a bearish sentiment in the short term.
Conclusion:
Based on the analysis of the technical indicators, the stock is likely to experience sideways movement in the coming days, with a potential for slight downside bias due to the bearish MACD signal. Investors should exercise caution and wait for clearer signals before making significant trading decisions.