Technical Analysis of MNDY 2024-05-10
Overview:
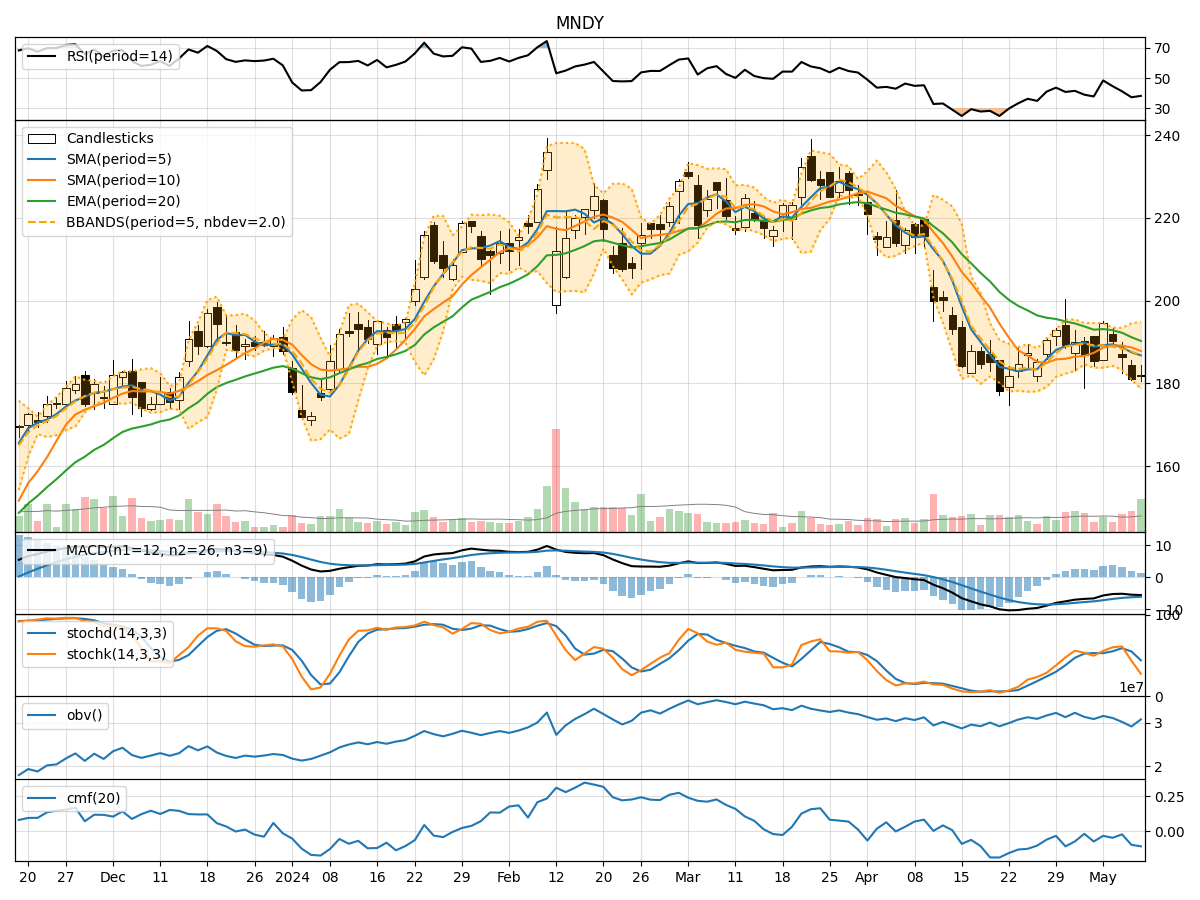
In analyzing the technical indicators for MNDY over the last 5 days, we will delve into the trend, momentum, volatility, and volume indicators to provide a comprehensive outlook on the possible stock price movement in the coming days.
Trend Analysis:
- Moving Averages (MA): The 5-day Moving Average (MA) has been declining steadily, indicating a bearish trend in the short term.
- MACD: The Moving Average Convergence Divergence (MACD) is also negative, suggesting a bearish momentum in the stock.
- EMA: The Exponential Moving Average (EMA) is below the current price, further supporting the bearish sentiment.
Momentum Analysis:
- RSI: The Relative Strength Index (RSI) is below 50, indicating a bearish momentum in the stock.
- Stochastic Oscillator: Both %K and %D are trending downwards, signaling a bearish momentum.
- Williams %R: The Williams %R is in oversold territory, suggesting a potential reversal or continuation of the downtrend.
Volatility Analysis:
- Bollinger Bands: The Bollinger Bands are widening, indicating increased volatility in the stock price.
- Bollinger %B: The %B is below 1, suggesting the stock is trading below the lower Bollinger Band, indicating a potential oversold condition.
Volume Analysis:
- On-Balance Volume (OBV): The OBV has been decreasing, indicating selling pressure in the stock.
- Chaikin Money Flow (CMF): The CMF is negative, suggesting outflow of money from the stock.
Key Observations:
- The stock is currently in a bearish trend based on moving averages and MACD.
- Momentum indicators like RSI and Stochastic Oscillator support the bearish sentiment.
- Volatility is increasing, indicating potential larger price swings.
- Volume indicators show a decrease in buying interest.
Conclusion:
Based on the analysis of the technical indicators, the next few days' possible stock price movement for MNDY is likely to be bearish. The stock is showing signs of weakness in trend, momentum, and volume, with increasing volatility. Traders and investors should exercise caution and consider short-term selling opportunities or wait for a clearer signal of a trend reversal before considering long positions.