Technical Analysis of MLGO 2024-05-10
Overview:
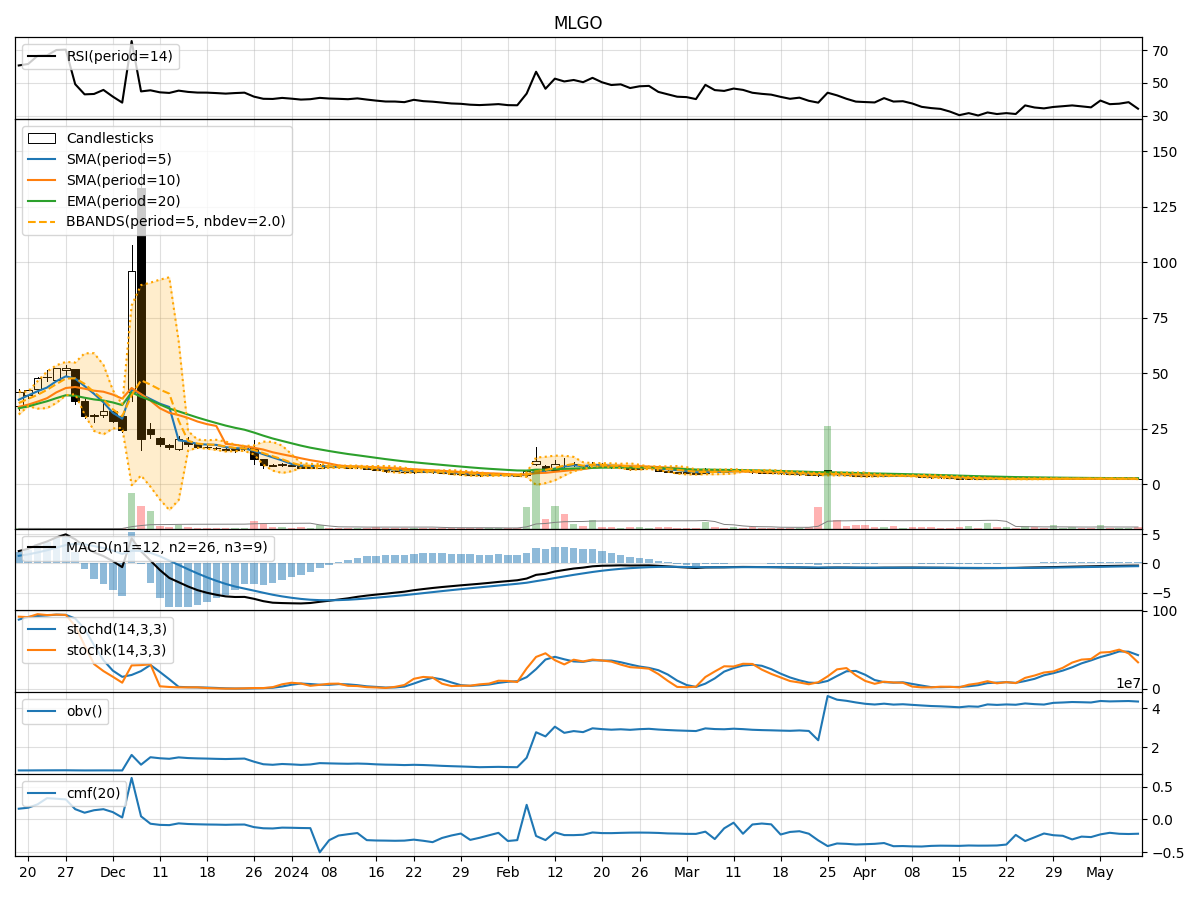
In analyzing the technical indicators for MLGO over the last 5 days, we will delve into the trend, momentum, volatility, and volume indicators to provide a comprehensive outlook on the possible stock price movement in the coming days. By examining these key indicators, we aim to offer valuable insights and predictions for potential investors.
Trend Analysis:
- Moving Averages (MA): The 5-day MA has been gradually decreasing, indicating a short-term downtrend in the stock price.
- MACD: The MACD line has been consistently below the signal line, suggesting bearish momentum in the stock.
- EMA: The exponential moving average has also been declining, further supporting the bearish trend in the stock.
Momentum Analysis:
- RSI: The Relative Strength Index has been hovering around the oversold territory, indicating a potential reversal or consolidation phase.
- Stochastic Oscillator: Both %K and %D have been trending downwards, signaling weakening momentum in the stock.
- Williams %R: The Williams %R is in the oversold region, suggesting a possible buying opportunity in the near term.
Volatility Analysis:
- Bollinger Bands: The stock price has breached the lower Bollinger Band, indicating oversold conditions and a potential reversal or bounce back.
- Bollinger Band Width: The band width has widened, suggesting increased volatility in the stock price movement.
Volume Analysis:
- On-Balance Volume (OBV): The OBV has been relatively stable, indicating a balance between buying and selling pressure.
- Chaikin Money Flow (CMF): The CMF has been negative, reflecting outflow of money from the stock.
Key Observations:
- The stock is currently in a downtrend based on moving averages and MACD.
- Momentum indicators suggest a potential reversal or consolidation phase.
- Volatility has increased, indicating potential price swings.
- Volume indicators show a balance between buying and selling pressure.
Conclusion:
Based on the analysis of technical indicators, the stock is currently bearish in the short term. However, given the oversold conditions indicated by momentum and volatility indicators, there might be a potential reversal or consolidation in the coming days. Investors should closely monitor key support and resistance levels for any signs of a trend reversal. It is advisable to wait for confirmation signals before making any trading decisions.