Technical Analysis of MLEC 2024-05-10
Overview:
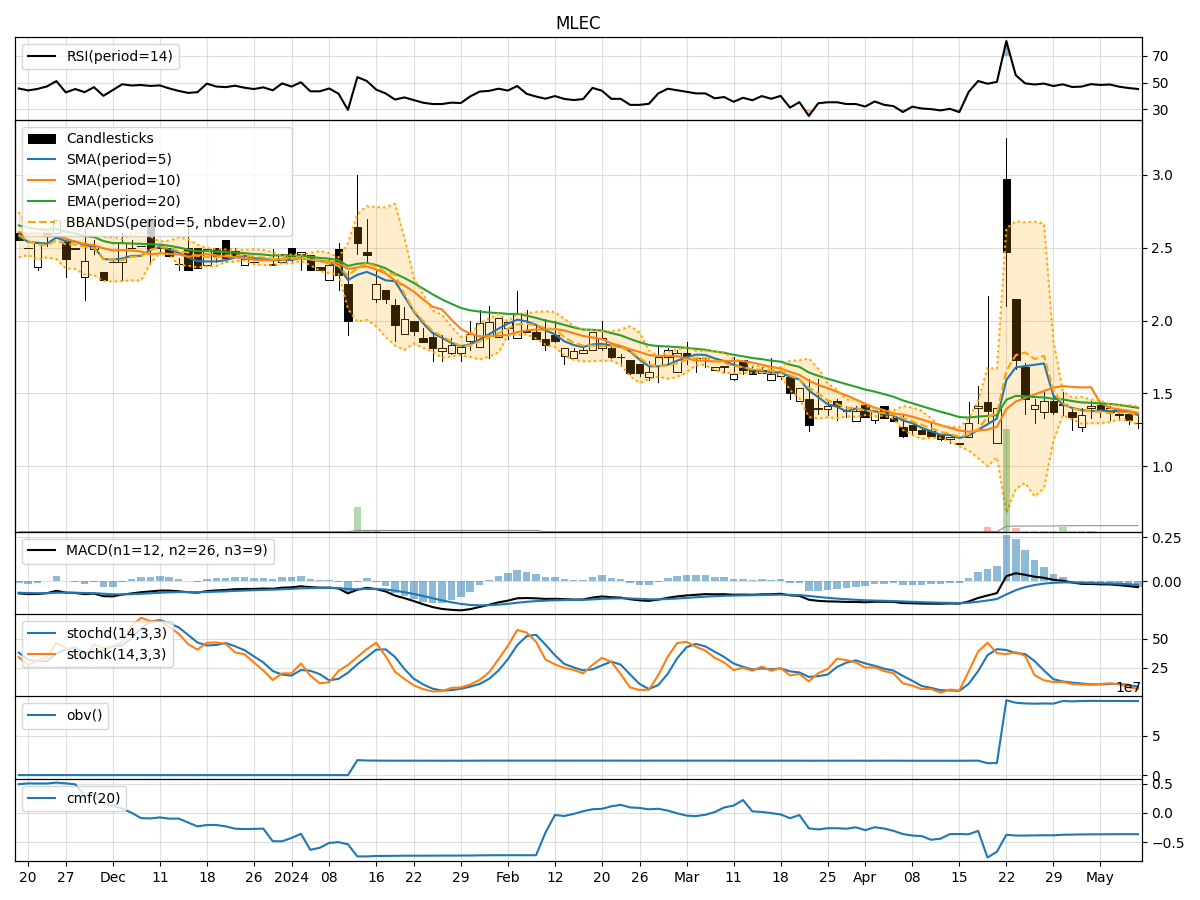
In analyzing the technical indicators for MLEC stock over the last 5 days, we will delve into the trends, momentum, volatility, and volume indicators to provide a comprehensive outlook on the possible stock price movement in the coming days. By examining these key indicators, we aim to offer valuable insights and predictions for potential investors.
Trend Analysis:
- Moving Averages (MA): The 5-day moving average has been declining steadily, indicating a bearish trend in the short term.
- MACD (Moving Average Convergence Divergence): The MACD line has been consistently negative, suggesting a bearish momentum in the stock.
- EMA (Exponential Moving Average): The EMA has also been trending downwards, reinforcing the bearish sentiment in the stock.
Momentum Analysis:
- RSI (Relative Strength Index): The RSI has been decreasing, indicating weakening momentum and potential oversold conditions.
- Stochastic Oscillator: Both %K and %D have been declining, signaling a bearish momentum in the stock.
- Williams %R (Willams Percentage Range): The Williams %R is in the oversold territory, suggesting a potential reversal or bounce in the stock price.
Volatility Analysis:
- Bollinger Bands: The stock price has been trading below the lower Bollinger Band, indicating oversold conditions and potential for a reversal.
- Bollinger Band Width: The Band Width has been narrowing, suggesting a decrease in volatility and a possible period of consolidation.
- Bollinger Band %B: The %B is below 0.2, indicating that the stock is oversold and may see a bounce in the near future.
Volume Analysis:
- On-Balance Volume (OBV): The OBV has been declining, indicating selling pressure in the stock.
- Chaikin Money Flow (CMF): The CMF has been negative, suggesting outflow of money from the stock.
Conclusion:
Based on the analysis of the technical indicators, the stock of MLEC is currently in a bearish phase with downward momentum. The stock is oversold according to various indicators like RSI, Williams %R, and Bollinger Bands, which may lead to a potential reversal or short-term bounce in the stock price. However, the overall trend remains bearish based on moving averages and MACD.
Investors should exercise caution and consider waiting for confirmation of a trend reversal before considering any buying opportunities. The stock is likely to experience volatility in the coming days, with a possible sideways movement or consolidation before a clear direction emerges. It is advisable to closely monitor the key technical levels and wait for strong signals before making any trading decisions.