Technical Analysis of MIST 2024-05-10
Overview:
In analyzing the technical indicators for MIST stock over the last 5 days, we will delve into the trend, momentum, volatility, and volume indicators to provide a comprehensive outlook on the possible future stock price movement. By examining these key indicators, we aim to offer valuable insights and predictions for the upcoming trading days.
Trend Analysis:
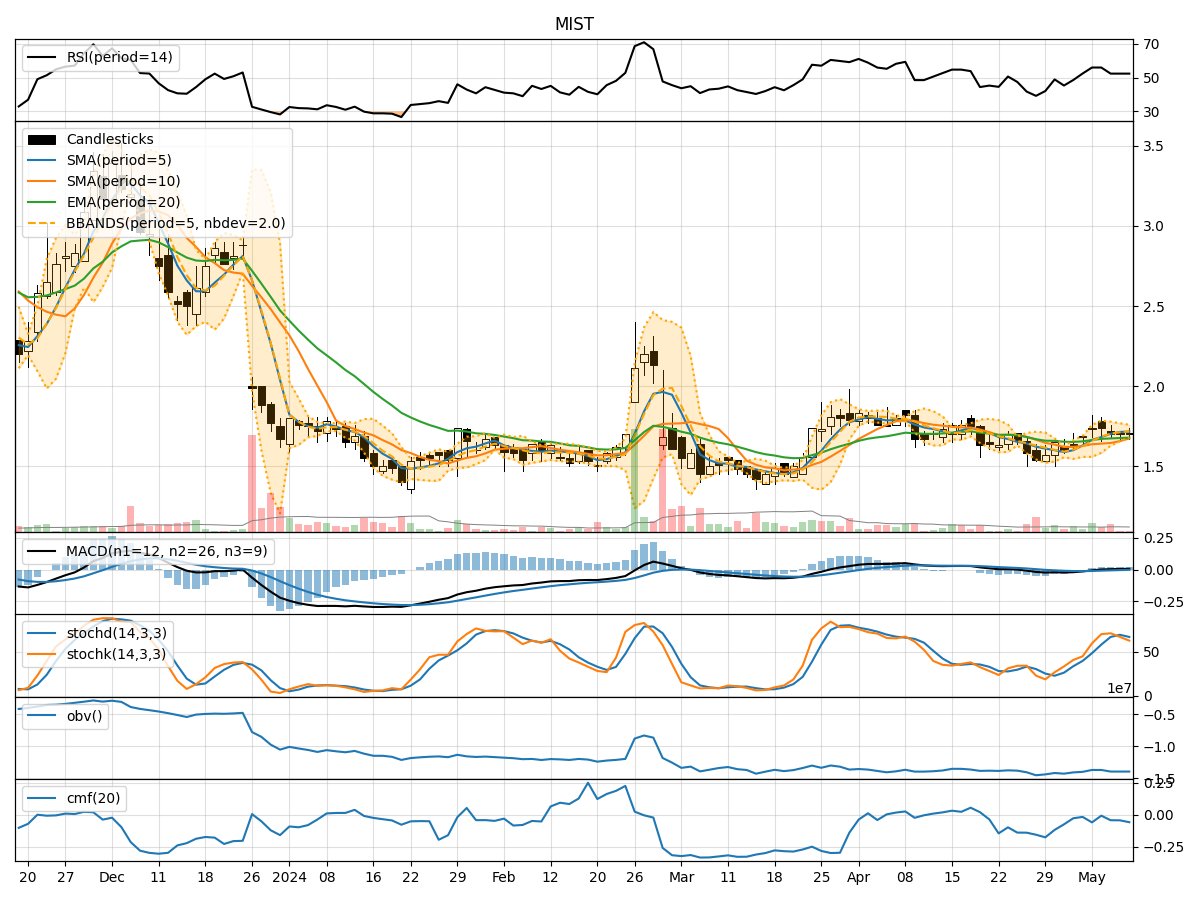
- Moving Averages (MA): The 5-day Moving Average (MA) has been steadily increasing, indicating a positive trend in the stock price.
- MACD: The MACD line has been consistently above the signal line, suggesting bullish momentum in the stock.
- EMA: The Exponential Moving Average (EMA) has been trending upwards, supporting the bullish sentiment in the stock.
Key Observation: The trend indicators point towards a bullish outlook for MIST stock.
Momentum Analysis:
- RSI: The Relative Strength Index (RSI) has been hovering around the 50 level, indicating neutral momentum in the stock.
- Stochastic Oscillator: Both %K and %D have been fluctuating in the neutral zone, reflecting indecision in the stock price movement.
- Williams %R: The Williams %R is also indicating a neutral stance, neither overbought nor oversold.
Key Observation: The momentum indicators suggest a sideways movement in the stock price.
Volatility Analysis:
- Bollinger Bands: The Bollinger Bands width has been narrowing, indicating decreasing volatility in the stock.
- Bollinger %B: The %B indicator is below 1, suggesting the stock is trading below the upper Bollinger Band.
- Bollinger Band Width: The Band Width has been contracting, signaling a potential decrease in volatility.
Key Observation: Volatility indicators point towards a consolidation phase in the stock price.
Volume Analysis:
- On-Balance Volume (OBV): The OBV has been relatively stable, indicating no significant divergence between price and volume.
- Chaikin Money Flow (CMF): The CMF has been negative, suggesting selling pressure in the stock.
Key Observation: Volume indicators imply a neutral to bearish sentiment in the stock.
Conclusion:
Based on the analysis of trend, momentum, volatility, and volume indicators, the overall outlook for MIST stock in the next few days is as follows: - Trend: Upward - Momentum: Sideways - Volatility: Consolidation - Volume: Neutral to Bearish
Recommendation:
Considering the mixed signals from different indicators, it is advisable to exercise caution when trading MIST stock in the upcoming days. Investors may consider waiting for more clarity in the market dynamics before making significant trading decisions.