Technical Analysis of MHLD 2024-05-10
Overview:
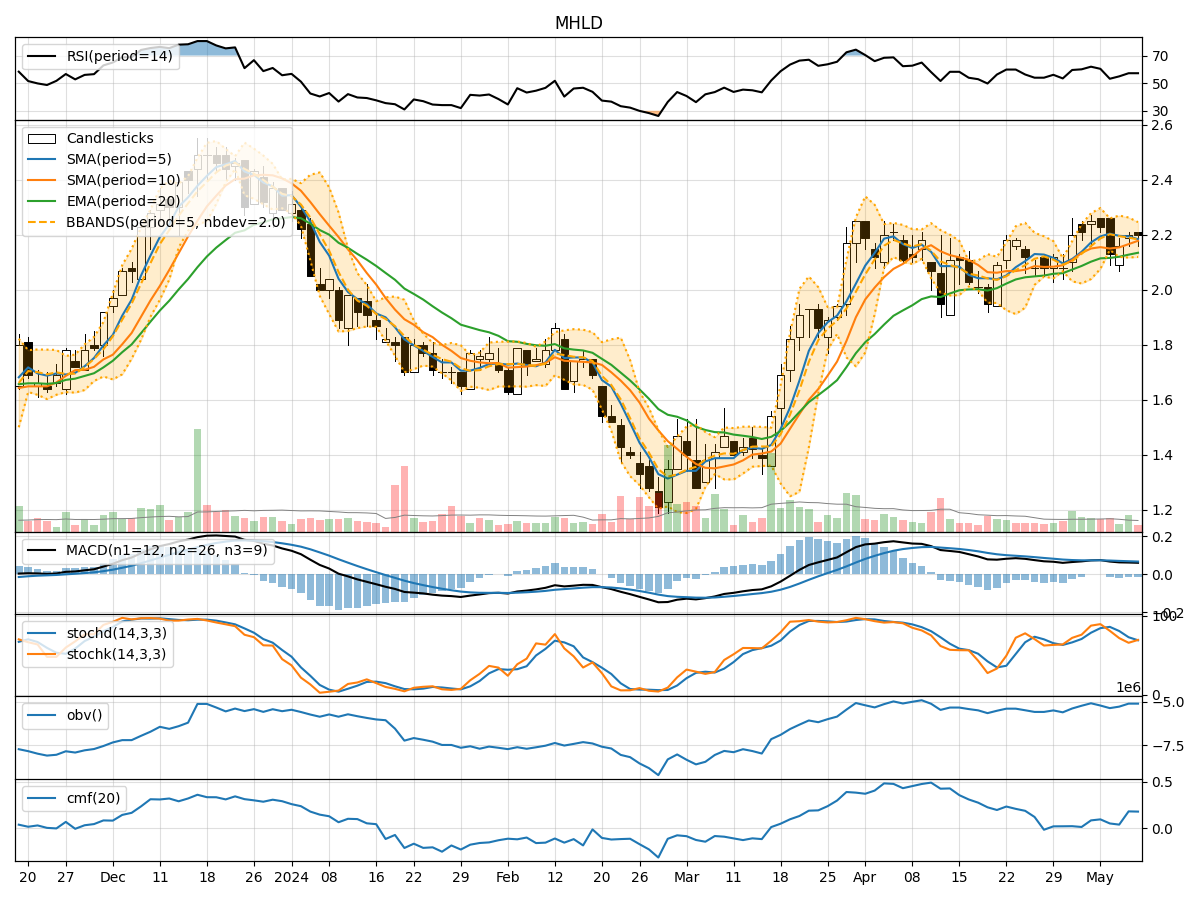
In analyzing the technical indicators for MHLD over the last 5 days, we will delve into the trend, momentum, volatility, and volume indicators to provide a comprehensive outlook on the possible stock price movement. By examining these key aspects, we aim to offer valuable insights and predictions for the upcoming days.
Trend Analysis:
- Moving Averages (MA): The 5-day Moving Average (MA) has been fluctuating around the closing prices, indicating a relatively stable trend.
- MACD: The Moving Average Convergence Divergence (MACD) has shown positive values, suggesting a bullish momentum in the short term.
- EMA: The Exponential Moving Average (EMA) has been gradually increasing, reflecting a positive trend in the stock price.
Momentum Analysis:
- RSI: The Relative Strength Index (RSI) has been hovering around the mid-level, indicating a neutral momentum in the stock.
- Stochastic Oscillator: The Stochastic indicators have shown a slight decline but remain within the neutral zone, suggesting a lack of strong directional momentum.
Volatility Analysis:
- Bollinger Bands (BB): The Bollinger Bands have shown narrowing volatility, with the stock price consolidating within the bands.
- BB Percentage (BBP): The BB Percentage has been relatively low, indicating a period of consolidation and potential breakout.
Volume Analysis:
- On-Balance Volume (OBV): The OBV has shown mixed movements, reflecting indecision among investors regarding the stock.
- Chaikin Money Flow (CMF): The CMF has been positive, indicating some buying pressure in the stock.
Key Observations:
- The stock has been trading within a narrow range, indicating consolidation and indecision among market participants.
- The MACD and EMA suggest a slightly bullish bias in the short term, supported by positive momentum indicators.
- Volatility has been decreasing, signaling a potential breakout or continuation of the current trend.
- Volume indicators show mixed signals, reflecting uncertainty in the market sentiment.
Conclusion:
Based on the analysis of the technical indicators, the stock price of MHLD is likely to continue trading sideways in the near term. While there are indications of a slight bullish bias from the MACD and EMA, the overall lack of strong momentum and mixed volume signals suggest a lack of clear direction. Traders should exercise caution and wait for a decisive breakout or trend confirmation before taking significant positions.