Technical Analysis of MGIH 2024-05-10
Overview:
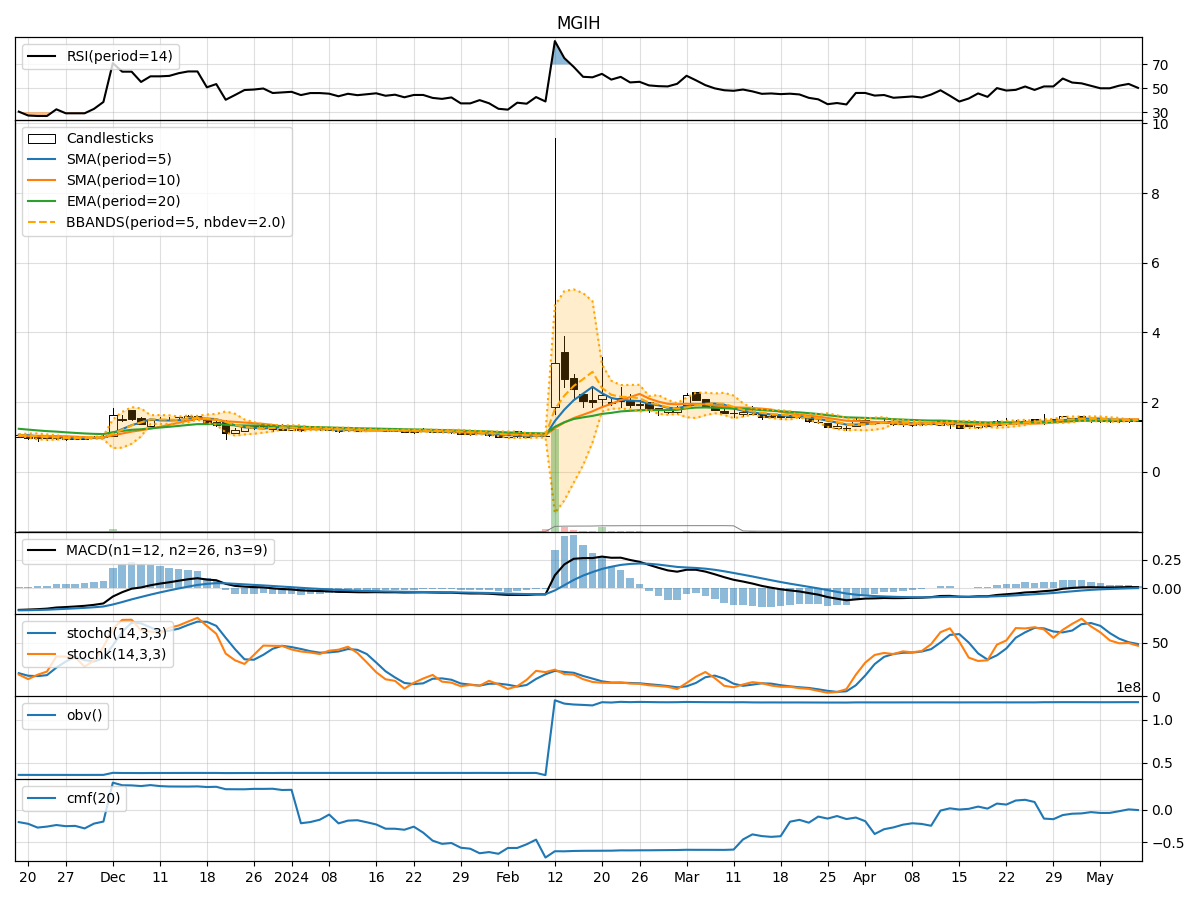
In analyzing the technical indicators for MGIH over the last 5 days, we will delve into the trend, momentum, volatility, and volume indicators to provide a comprehensive outlook on the possible stock price movement in the coming days.
Trend Analysis:
- Moving Averages (MA): The 5-day Moving Average (MA) has been declining slightly, indicating a short-term bearish trend.
- MACD: The MACD line has been consistently below the signal line, suggesting a bearish momentum.
- EMA: The Exponential Moving Average (EMA) has shown a slight uptrend, but it might not be strong enough to reverse the overall bearish sentiment.
Momentum Analysis:
- RSI: The Relative Strength Index (RSI) has been hovering around the neutral zone, indicating a lack of strong momentum in either direction.
- Stochastic Oscillator: Both %K and %D have been declining, signaling a potential bearish momentum.
- Williams %R: The Williams %R is in the oversold territory, suggesting a possible reversal to the upside.
Volatility Analysis:
- Bollinger Bands (BB): The Bollinger Bands have been narrowing, indicating decreasing volatility and a potential breakout in the near future.
- Bollinger %B: The %B indicator is below 0.5, suggesting the stock is trading below the lower band and might be oversold.
Volume Analysis:
- On-Balance Volume (OBV): The OBV has been relatively flat, indicating a balance between buying and selling pressure.
- Chaikin Money Flow (CMF): The CMF has been negative, suggesting a bearish money flow into the stock.
Key Observations and Opinions:
- The trend indicators show a mixed picture with a slight bearish bias.
- Momentum indicators suggest a lack of strong momentum but with a potential for a bullish reversal.
- Volatility indicators point towards a potential breakout due to decreasing volatility.
- Volume indicators indicate a balance between buying and selling pressure with a bearish money flow.
Conclusion:
Based on the analysis of the technical indicators, the next few days for MGIH could see sideways consolidation with a potential for a bullish reversal. Traders should closely monitor the Williams %R for a possible entry point and keep an eye on the Bollinger Bands for a breakout signal. It is advisable to wait for confirmation from both momentum and volume indicators before making any significant trading decisions.