Technical Analysis of META 2024-05-10
Overview:
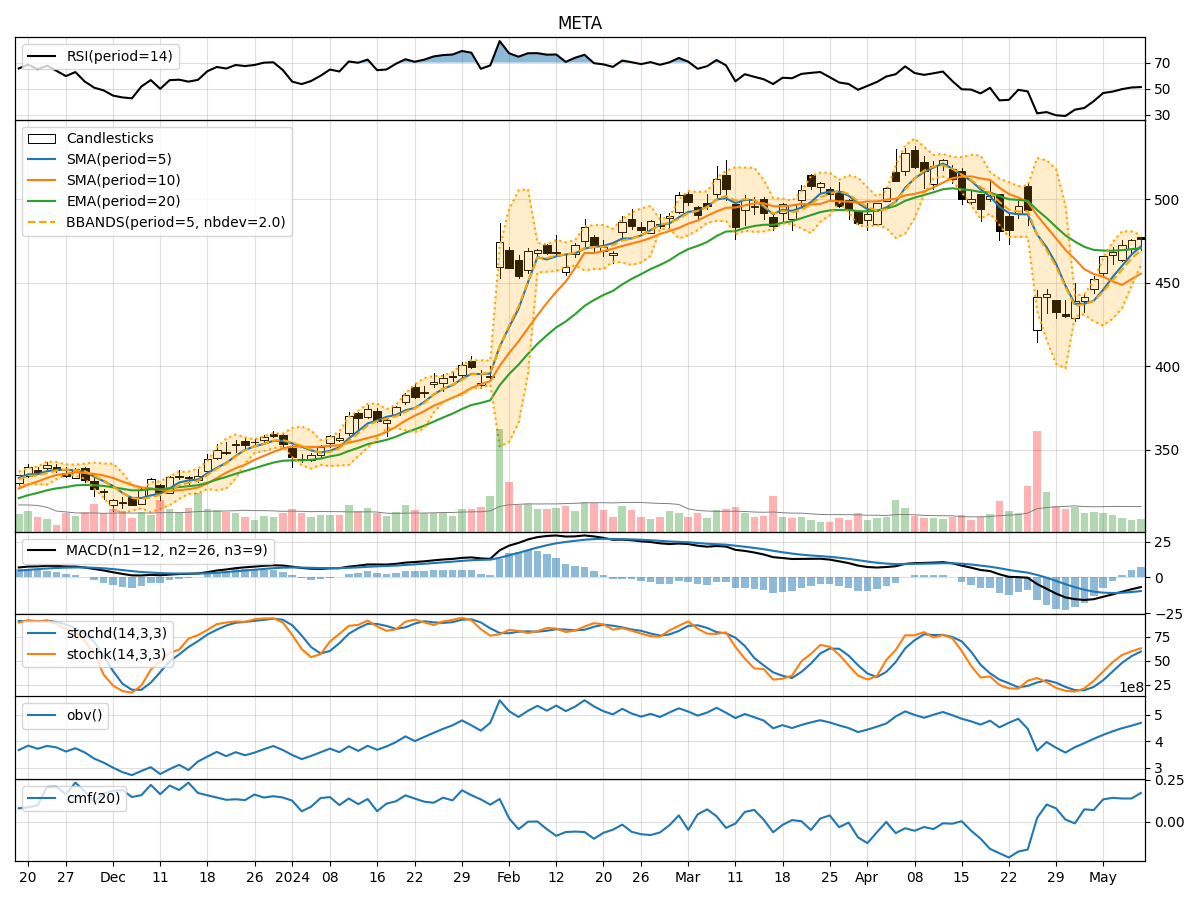
In analyzing the technical indicators for META stock over the last 5 days, we will delve into the trend, momentum, volatility, and volume indicators to provide a comprehensive outlook on the possible stock price movement in the coming days. By examining these key indicators, we aim to offer valuable insights and predictions for potential investors.
Trend Analysis:
- Moving Averages (MA): The 5-day Moving Average has been consistently rising, indicating a bullish trend in the short term.
- MACD: The MACD line has been increasing, with the MACD histogram showing positive values, suggesting a strengthening bullish momentum.
- EMA: The Exponential Moving Average has been trending upwards, supporting the bullish sentiment in the stock.
Momentum Analysis:
- RSI: The Relative Strength Index has been gradually increasing but remains below the overbought threshold, indicating room for further upside potential.
- Stochastic Oscillator: Both %K and %D lines of the Stochastic Oscillator are in the overbought zone, suggesting a potential pullback in the near term.
- Williams %R: The Williams %R is in the oversold territory, signaling a possible reversal to the upside.
Volatility Analysis:
- Bollinger Bands: The stock price has been trading within the upper Bollinger Band, indicating an overbought condition. However, the bands are narrowing, suggesting a potential decrease in volatility.
- Bollinger %B: The %B indicator is above 0.8, indicating that the stock is trading near the upper band, potentially signaling a short-term reversal.
Volume Analysis:
- On-Balance Volume (OBV): The OBV has been steadily increasing, reflecting accumulation by investors.
- Chaikin Money Flow (CMF): The CMF is positive, indicating buying pressure in the stock.
Conclusion:
Based on the technical indicators analyzed: - Trend: The stock is in a strong upward trend. - Momentum: There are mixed signals with the RSI showing potential for further upside but the Stochastic Oscillator signaling a possible pullback. - Volatility: The narrowing Bollinger Bands suggest a decrease in volatility, possibly leading to a period of consolidation. - Volume: The increasing OBV and positive CMF indicate bullish sentiment among investors.
Overall View:
Considering the bullish trend, positive momentum, decreasing volatility, and strong volume accumulation, the outlook for META stock in the next few days is bullish. Investors may expect the stock price to continue its upward trajectory, with potential short-term fluctuations due to overbought conditions. It is advisable to monitor the Stochastic Oscillator for a possible pullback and the Bollinger Bands for signs of consolidation.