Technical Analysis of MERC 2024-05-10
Overview:
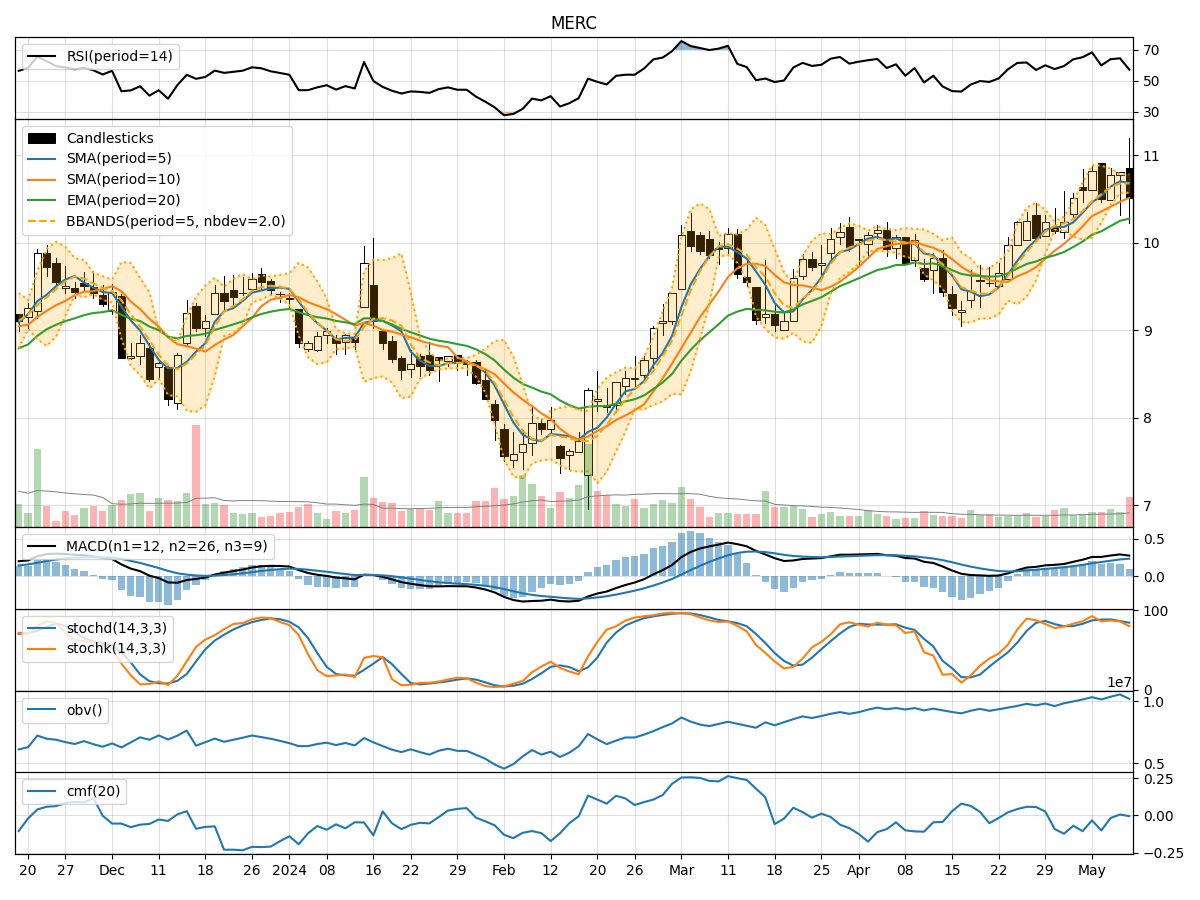
In the last 5 trading days, MERC stock has shown mixed signals across various technical indicators. The trend indicators suggest a slightly bullish sentiment, with moving averages trending upwards. Momentum indicators indicate a neutral to slightly bearish momentum, while volatility indicators show a decreasing trend in volatility. Volume indicators also reflect a mixed sentiment.
Trend Indicators:
- Moving Averages (MA): The 5-day MA is above the 10-day SMA and EMA(20), indicating a short-term bullish trend.
- MACD: The MACD line is positive, suggesting a bullish momentum.
- MACD Histogram: The histogram is positive but showing a slight decrease in bullish momentum.
Momentum Indicators:
- RSI: The RSI is in the neutral zone, indicating neither overbought nor oversold conditions.
- Stochastic Oscillator: Both %K and %D are in the neutral zone, suggesting a lack of clear direction.
- Williams %R: The indicator is in the oversold territory, indicating a potential buying opportunity.
Volatility Indicators:
- Bollinger Bands: The bands are narrowing, indicating decreasing volatility.
- Bollinger %B: The %B is close to the lower band, suggesting a possible oversold condition.
Volume Indicators:
- On-Balance Volume (OBV): The OBV is showing a slight decrease, indicating some selling pressure.
- Chaikin Money Flow (CMF): The CMF is negative, suggesting a bearish money flow.
Key Observations:
- The trend indicators suggest a bullish bias, supported by moving averages and MACD.
- Momentum indicators show a lack of clear direction, with RSI in the neutral zone.
- Volatility is decreasing, indicating a potential consolidation phase.
- Volume indicators reflect mixed signals, with OBV showing a slight decrease and CMF indicating bearish money flow.
Conclusion:
Based on the analysis of technical indicators, the next few days for MERC stock are likely to see sideways movement with a slight bullish bias. The decreasing volatility and mixed momentum signals suggest a period of consolidation. Traders may consider waiting for clearer signals before taking significant positions.