Technical Analysis of MELI 2024-05-10
Overview:
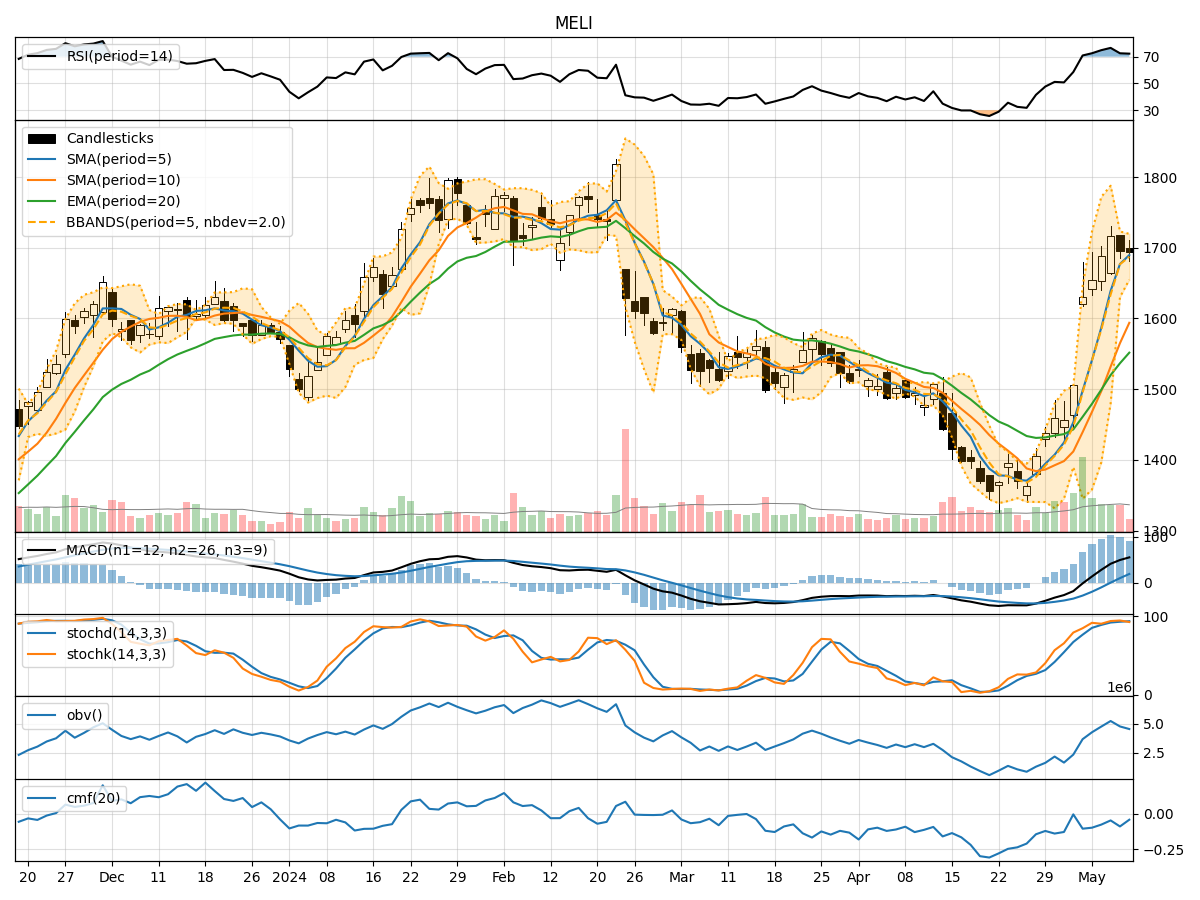
In analyzing the technical indicators for MELI over the last 5 days, we will delve into the trend, momentum, volatility, and volume indicators to provide a comprehensive outlook on the possible stock price movement. By examining these key aspects, we aim to offer valuable insights and predictions for the upcoming days.
Trend Analysis:
- Moving Averages (MA): The 5-day MA has been consistently rising, indicating a bullish trend in the short term.
- MACD: The MACD line has been above the signal line, suggesting bullish momentum.
- EMA: The exponential moving average has also been trending upwards, supporting the bullish sentiment.
Key Observation: The trend indicators point towards a strong bullish trend in the short term.
Momentum Analysis:
- RSI: The Relative Strength Index has been in the overbought territory, indicating a potential reversal or consolidation.
- Stochastic Oscillator: Both %K and %D have been relatively high, signaling potential overbought conditions.
- Williams %R: The indicator has been in the oversold region, suggesting a possible reversal.
Key Observation: Momentum indicators show mixed signals with a potential for a short-term pullback or consolidation.
Volatility Analysis:
- Bollinger Bands: The bands have been narrowing, indicating decreasing volatility.
- Bollinger %B: The %B indicator has been decreasing, suggesting a potential price consolidation.
- Average True Range (ATR): ATR has been decreasing, reflecting lower volatility levels.
Key Observation: Volatility indicators point towards a period of consolidation or a decrease in price fluctuations.
Volume Analysis:
- On-Balance Volume (OBV): The OBV has been declining, indicating selling pressure.
- Chaikin Money Flow (CMF): The CMF has been negative, suggesting outflow of money from the stock.
Key Observation: Volume indicators signal a bearish sentiment with higher selling pressure.
Conclusion:
Based on the analysis of the technical indicators, the stock price of MELI is likely to experience a short-term pullback or consolidation. The trend indicators support a bullish outlook, but the momentum indicators suggest a potential reversal or consolidation. Volatility indicators point towards decreased price fluctuations, while volume indicators indicate higher selling pressure.
Overall, the next few days may see MELI's stock price moving in a sideways pattern with a slight bearish bias. Traders should exercise caution and consider potential entry or exit points based on the evolving market dynamics.